U.S. Retail Sales Bounce on Federally Subsidized Auto Sales
Economics / US Economy Sep 15, 2009 - 01:22 AM GMTBy: John_Mauldin
 One of my favorite sources of information is The Liscio Report by Philippa Dunne & Doug Henwood. Among other things, each month they survey all the states about tax revenues, expenses and then give us the results in a very pithy fashion. No one pays taxes unless they have to, and thus taxes tell us a lot about the current spending and income situation. Taxes are a far more reliable indicator then surveys, which most "data" is based on.
They also look at various trends in a variety of topics. No surprise, this issue they talk about the numbers on retail sales, noting certain segments are up (essential spending) but sales for non-essential items are way down. This is very interesting to me. It is, as they point out, part of the journey to the new normal. They graciously allowed me to send this letter on to you as this week's Outside the Box. Those of you who might wish to learn more about theme can go to www.theliscioreport.com or drop them a note at online@theliscioreport.com.
John Mauldin, Editor Outside the Box
Penury, Self-imposed or Inflicted, the New Normal?
The Liscio Report on the Economy
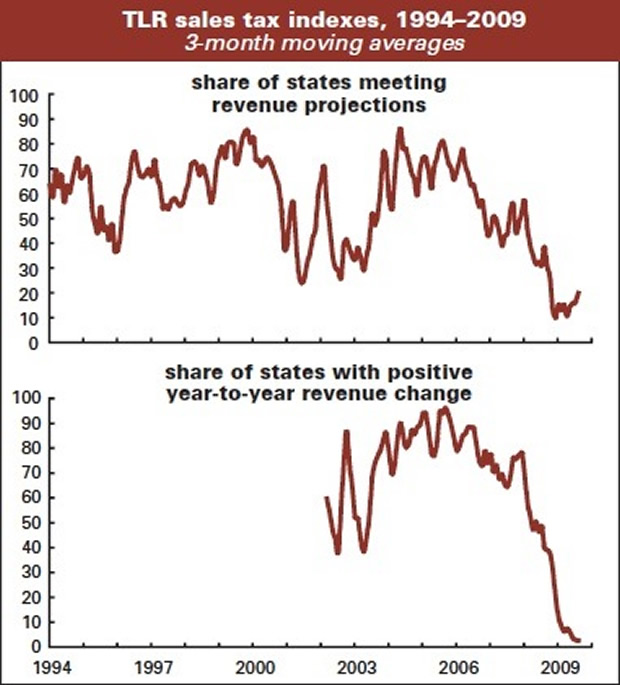
In August, 30% of the states in our survey met or exceeded their forecasted sales tax collections. This is a big jump from July's 12%, and the best showing since August 2008's 50%. The percentage of states reporting growth over the year was just 1.43%, down from July's 1.59%, so basically flat and zero, and the intensity index (over the year percentage change weighted by state population) rose to -7.0% from July's -8.3%.
It is good news that actual collections are in line with forecasts for a larger percentage of our contacts, and in our universe narrowing the gap between actual collections and forecasts is the first step toward real improvement, no matter how weak those forecasts are.
We do want to underscore that forecasts have been revised down hard, and continue to be for extremely weak collections, in almost all cases negative over the year, and in some for double-digit declines.
Our sales tax survey began falling from its recent high of 81 in February 2006, edged back up to the low 70s in fall of 2007, and has fallen, albeit noisily, since. Sales receipts falling below prior-year levels has in the past been a sporadic and mostly calendar-driven event.
Currently many states have seen negative collections for over a year and, if we're lucky, the survey is now stabilizing in "unheard of territory." That's what led one contact to say: "Now, before we throw a party to celebrate the best monthly performance since November (-3.6%) - let's realize it still sucks and shows how much consumer retrenchment is still in place. Adjusting for calendar effects, we now have had 14 months of negative sales tax."

Tentatively encouraging news is that although there is no demographic or regional pattern, at least the survey did not come in with prior months' resounding thud: although the majority of our contacts are not seeing any real improvement, and supplying discouraging details, some contacts are reporting an improving situation, along with some stability in housing and their own confidence surveys. But concerns about heavy headwinds and what will happen now that Cash for Clunkers has clunked out remain in the forefront.
Just The Essentials
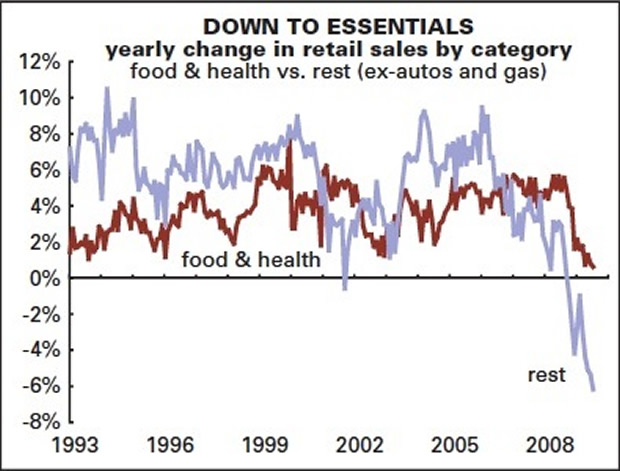
It's been a few months since we updated our graph of retail spending on essentials vs. more discretionary items. As of July, it looks like consumers are still concentrating on the essentials.
Graphed below are the yearly (nominal) changes in spending in food and beverage stores and drugstores compared to the changes in all other spending (less autos and gas). (Gas is also mostly an essential, but its price has been so volatile that it clouds the picture somewhat; still, the graphs would look little different had we included it as an essential.) For the year ending in July, spending on essentials, by this definition, was up 0.6%; spending on everything else was off 6.2%. That gap, 6.8%, is the widest since the new retail series began in 1992.

A gap this wide looks like a real structural shift in spending behavior, as austerity becomes the new normal. Though Americans have shaken off bouts of prudence before, like that of the early 1990s, with consumer credit constricted, household balance sheets ravaged, and labor income weak, it's probably going to take some time before anything resembling extravagance returns.
The Auto Bounce
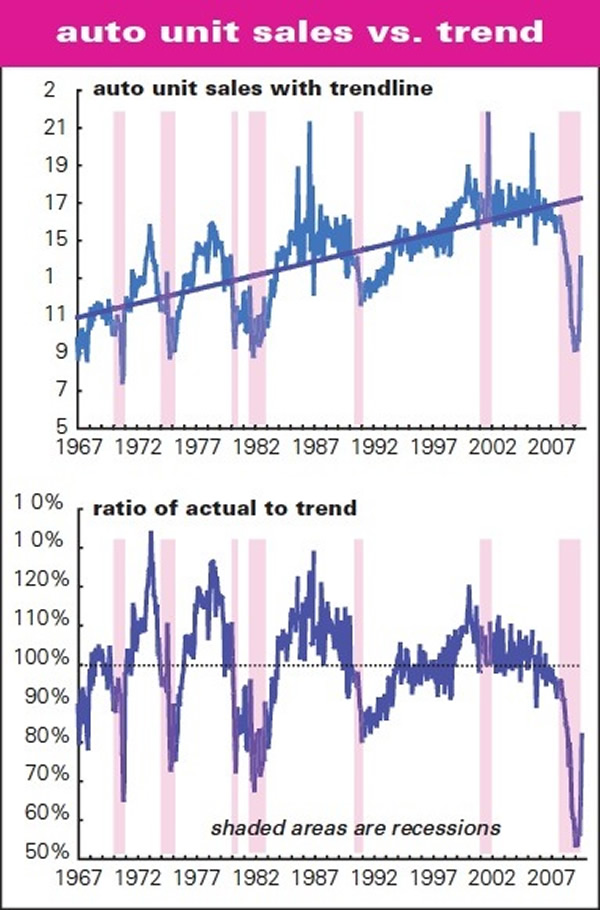
That said, the federally subsidized bounce in auto sales in August was an extraordinary departure from recent trends (see graphs). It's not the biggest monthly leap ever -- sales rose 35% in October 2001 (thanks to the post-9/11 sales incentives), and 43% in January 1971 (following a strike against GM, which depressed sales late in 1970) -- but it's still impressive. Unit sales, which have been running almost 50% below trend for most of this year, rose to 82% of trend, the highest in nearly a year and a half.

As the graphs show, that bounce looks like earlier end-of-recession turns. The question is, of course, how much of this can be sustained without Washington's help. A $4,500 subvention isn't just gravy -- it's practically a meal in itself. Given how depressed sales have been -- though there was no serious decline in auto sales during the 2001 recession, the recent slump is without precedent in more than 40 years of monthly unit sales data -- there's room for a substantial bounce. But will incomes and the credit markets be there to fund one?
Credit Retrenchment
Speaking of consumer credit, July's decline, while not the worst ever, was about two standard deviations below the mean -- and the yearly decline is now the sharpest ever. (See graphs) The decline is being driven by revolving credit, meaning mainly credit cards. Partly offsetting that contraction, though, is continued strength in revolving home equity lines of credit (HELCs), whose yearly growth is surprisingly closer to its 2004 high than the 0 line.


And, as we keep pointing out, the longer-term picture suggests that deleveraging has only begun. Measured against after-tax income, consumer debt levels are drifting lower, but have a long way to go even to get back to late 1990s levels.
That's especially true if you add HELCs to the traditional forms of consumer credit. Recent declines in the consumer debt burden are considerably milder than we saw in previous recessions (and note that the declines typically continue for at least several months after the cyclical trough).
Benefit Squeeze
With health reform in the news, we thought it might be interesting to take a look at what's been happening in the realm of employee benefits. In a phrase, it looks like employers have been enacting some reform of their own, and they may be feeling no great urgency for systemic changes.
For the year ending in the second quarter of 2009, benefit costs for private employers are were up just 1.3%, the lowest since the BLS series begins in 1983. (See graph) That's a remarkable swing from 2004's rise of 7.4%. Benefit costs are now rising more slowly than direct pay, which has hardly ever happened in the last 25 years.

As the graph shows, the swing isn't entirely the result of a squeeze in health benefits; other benefits, like pensions, are also being squeezed. Health insurance costs for employers are rising just over 4% a year. But that's way down from the over-11% tempo of 2002.
As the graph shows, though, that decline isn't the result of any serious slowdown in medical inflation. No doubt there's a lot of shifting of costs onto employees going on, either in the form of dropped coverage or higher co-pays.
As we pointed out in our July 13 issue, a substantial portion of the rise in consumption over the last couple of decades has been driven by spending on medical care. With all this apparent cost-shifting from employers to employees going on, pressures on household budgets have been increasing -- another reason to wonder where any sustained consumption revival can come from.
Tuesday's Retail Numbers
We're expecting August headline retail sales to come in at a stronger than consensus +2.5%, +0.6% excluding autos -- and a much more tepid +0.2% excluding both autos and their fuel. States tax motor vehicle sales in different ways, but the majority of those that break out sales taxes on autos saw dramatic increases in July and in August, and we expect auto sales to make a larger contribution to the headline than July's +0.5%.
In July the ICSC anticipated that a somewhat late back-to-school season moved 0.5% in sales from July into August, and their August numbers suggest this shift took place. Retailers were reportedly surprised that August was as good as it was, and the markets may well be surprised by a stronger than anticipated retail report.
Whatever the noisy series tells us about August shopping, however, we anticipate it will take an unusually long time for American consumers to have the confidence (and means) to begin spending again over the longer term.
-- Philippa Dunne & Doug Henwood
By John Mauldin
John Mauldin, Best-Selling author and recognized financial expert, is also editor of the free Thoughts From the Frontline that goes to over 1 million readers each week. For more information on John or his FREE weekly economic letter go to: http://www.frontlinethoughts.com/learnmore
To subscribe to John Mauldin's E-Letter please click here:http://www.frontlinethoughts.com/subscribe.asp
Copyright 2008 John Mauldin. All Rights Reserved
John Mauldin is president of Millennium Wave Advisors, LLC, a registered investment advisor. All material presented herein is believed to be reliable but we cannot attest to its accuracy. Investment recommendations may change and readers are urged to check with their investment counselors before making any investment decisions. Opinions expressed in these reports may change without prior notice. John Mauldin and/or the staff at Millennium Wave Advisors, LLC may or may not have investments in any funds cited above. Mauldin can be reached at 800-829-7273.
Disclaimer PAST RESULTS ARE NOT INDICATIVE OF FUTURE RESULTS. THERE IS RISK OF LOSS AS WELL AS THE OPPORTUNITY FOR GAIN WHEN INVESTING IN MANAGED FUNDS. WHEN CONSIDERING ALTERNATIVE INVESTMENTS, INCLUDING HEDGE FUNDS, YOU SHOULD CONSIDER VARIOUS RISKS INCLUDING THE FACT THAT SOME PRODUCTS: OFTEN ENGAGE IN LEVERAGING AND OTHER SPECULATIVE INVESTMENT PRACTICES THAT MAY INCREASE THE RISK OF INVESTMENT LOSS, CAN BE ILLIQUID, ARE NOT REQUIRED TO PROVIDE PERIODIC PRICING OR VALUATION INFORMATION TO INVESTORS, MAY INVOLVE COMPLEX TAX STRUCTURES AND DELAYS IN DISTRIBUTING IMPORTANT TAX INFORMATION, ARE NOT SUBJECT TO THE SAME REGULATORY REQUIREMENTS AS MUTUAL FUNDS, OFTEN CHARGE HIGH FEES, AND IN MANY CASES THE UNDERLYING INVESTMENTS ARE NOT TRANSPARENT AND ARE KNOWN ONLY TO THE INVESTMENT MANAGER.
John Mauldin Archive |
© 2005-2022 http://www.MarketOracle.co.uk - The Market Oracle is a FREE Daily Financial Markets Analysis & Forecasting online publication.


