Gold Price Forecast October 2009 Update
Commodities / Gold & Silver 2009 Oct 04, 2009 - 07:50 AM GMTBy: Bill_Downey
 There was financial life before the 2008 meltdown……….and there is going to be life after the 2008 meltdown. It is the most significant event in modern day financial history as far as the total effect and financial drawdown that it has unleashed. It’s a shock wave and repercussion that stems from the August 1971 removal of the United States Dollar from the gold standard by Richard M Nixon. If you have time I urge you to watch the broadcast from that evening. You can Google it. It’s worth the listen, especially listening to Nixon telling the American people that this is being done for their sake and their well being. Telling us that it’s to make the nation competitive again (sic). To teach the dollar speculators a lesson proclaimed Nixon. Watching it now, I couldn’t help but ponder how naïve we must all have been to swallow that dialogue.
But then I realized that it was no different than us doing nothing about the fact that our government is now 11 trillion dollars in debt and at this pace, will be printing about a trillion dollars every quarter just to stay afloat. When one is in the middle of a financial hurricane it’s very easy to stand like a deer in front of a set of headlights coming at us.
There are many things that could be listed as the most important events of the 20th century, but I would think that the cancelling of real money and the issuance of paper instead should have been right up there. What is really interesting is that the abandonment of the gold standard is not on any of these lists I’ve seen. Yet that one fell swoop has allowed the confiscation of the wealth of the populous.
There is a level of stress in any mechanism that when exceeded, a breakdown is unavoidable. The United States is approaching that level. In fact, because of its size, the breaking point is much like that of the Titanic. It’s already happened, but only the crew is aware of the problem. The passengers are still busy drinking, dancing and eating. They might have noticed the tilt but it won’t be until the see the water at their feet that they understand the depth of the trouble that is about to take hold. And like the Titanic, there are very few emergency life rafts on the deck. Most are going down with the ship. Except the crew, they will be the first on the life rafts. Going down with the ship is only in the movies. In real life, they are the first off the boat.
The question that some are pondering is whether this will spawn another gold bull market leg or is the worse over and gold is about to roll over?
Over the last 19 months gold bulls haven’t had a lot to cheer about as the market has been trapped in a large sideways price pattern. Although it came and went without a lot of media fanfare, gold achieved its highest quarter, monthly and weekly closes during the month of September. It was the first quarterly and monthly close above the triple digit 1000 dollar area.
To gold bugs, the 1000 dollar zone is equal to Hank Aaron tying the immortal Babe Ruth’s record of 714 home runs (729 with World Series stats). I say tying and not breaking for just one reason. The highest print price of gold was the 1033 area in 2008. But price was reversed quickly upon that foray and gold did not achieve the monthly, quarterly, weekly and even daily closes we have seen during the month of September. Once gold catapults above the 1033 area and above 1050-1070 in breakout fashion, then we can say that the record is broken and new heights will be seen in the price of gold. It will be like Aaron’s 715th home run. There will be no denying the achievement at that point. Speaking of closes, within three months, we are going to have a yearly and a DECADE closing price. Like a stealth bull market, gold has been rallying over 8 years, and has gone from 250 to 1000. The public has not even arrived yet. But now that we are at 1000, the news is going to start to spread and little by little people are going to become aware if we remain above 1000 and we continue rallying.
While there are many who will argue that 1000 is but a number and has no significant value I beg to differ. From a pure mathematical and statistical perspective they are right. 1000 is just a number. But markets are the reflection of the psychology of the masses that participate in them. And 1000 gold is just as important as Dow 1000 and Dow 10000 and Babe Ruth’s 714 home runs. When you see the price charts in this article, I think most will agree.
As we approach the final quarter of this decade it is clear to anyone who has kept up with their monthly/quarterly financial statements that we live in a world that is very uncertain, very volatile place that is very difficult to make sense of anything anymore. There was a time when gold was considered one of the most volatile and speculative arenas one could put his hard earned cash in. But those times have changed. Lately, gold has been the least volatile of most financial instruments. Take a look at the stock market or crude oil or the American dollar. (Never mind Soybeans, and Sugar !!!) The price swings in those markets are more dramatic, more volatile, and less trending than the gold market. Let’s take a look at the last three years courtesy of www.stockcharts.com

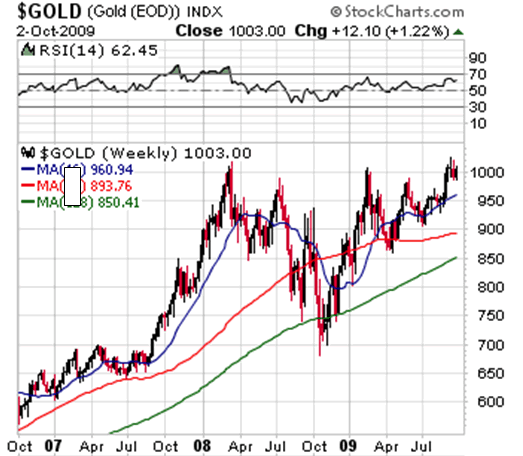
The gold chart above shows that over the last three years, gold is in a major uptrend and is only $150 dollars shy of a double in 36 months. We can see that the short, medium and long moving averages are all trending up and that the short term (blue) moving average is above the medium term (red) and the medium term (red) is above the long term (green) moving average. We can see that for the past three years, the long term moving average (green) has only been touched once (at the bottom 3 weeks of the financial meltdown of 2008.) We can see that price right now is above all three averages, and is within a day’s trading of an all time price high in gold.
Price looks to be on the verge of a breakout and we have just made a 20 month high as well as being less that 4% away from the all time high. People talk of the tremendous recovery in the stock market as it has retraced 50% of losses. Look at gold. It has retraced 100%. Since the meltdown bottom, gold has regained everything it lost.
There is only one more thing gold needs to do at this point in time to become FRONT and center in the investment world. AND THAT IS TO MAKE A BREAKOUT ABOVE THE 1050-1075 area. By going to a price where it has never gone before, gold would be giving the strongest buy signal one can expect.
How about all the other popular financial instruments? Let’s have a look.

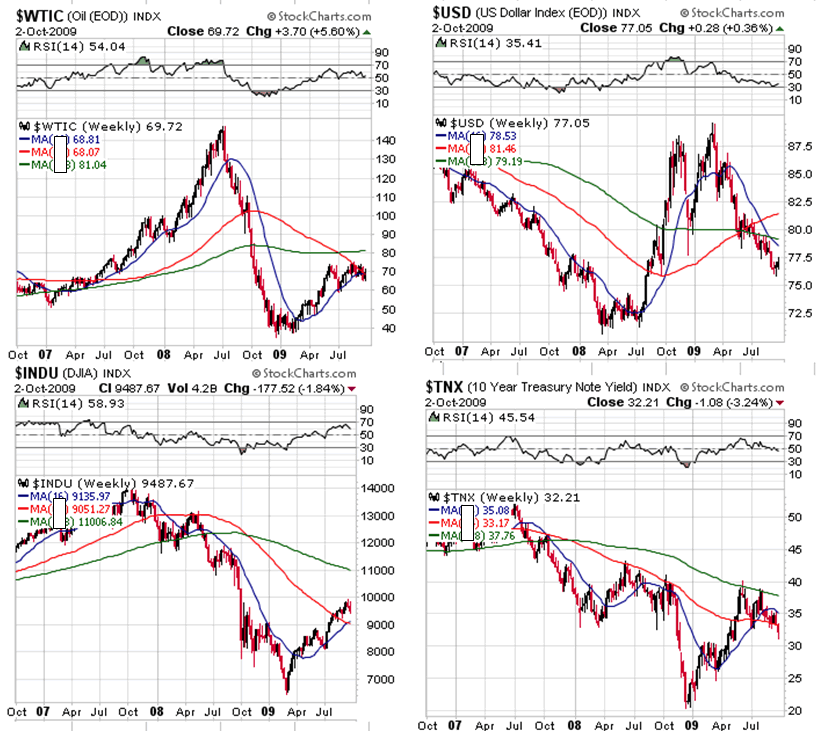
First up is West Texas Intermediate Crude Oil. We can see over the last three years that price is ………………UNCHANGED. We are at the same price as we were in October 2007. We can see only the short moving average is trending up (blue) and that the medium and long averages are ABOVE price and above the short term average. In fact, we can see that PRICE IS RIGHT at the medium and short averages as the price battle that has been going on there for the last 10 weeks is for control of the medium term trend. Most importantly, since the financial meltdown of 2008, crude oil is down a bit over 50% (from 147 to 70). Contrast that with gold which is off 3% from its peak. Finally, there can be no doubt that crude is more volatile than gold in these past three years.
Next up is the US Dollar. We can see that over the last three years the dollar is nearly 10% lower. We can see that the short term moving average is below the medium and long term moving averages (bearish). The long term moving average is below the medium term, and PRICE is below all three averages. The US Dollar was the only commodity that rallied during the meltdown, but the net gain from Oct 08 to now is virtually zero. Contrast that with gold which is up 30% since the meltdown low.
How about the stock market? We can see over the lat three years that the stock market is much lower than what it was in October of 2007. We can see that the short term is just now reaching the medium term moving average, and that the long term average is above both short and medium term moving average as well as above the current price. Since the financial meltdown of 2008 the dow is still almost 4000 points below the 07 July highs. Gold on the other hand is slightly above the highs of July 2007.
How about the bond market? Over the past 3 years, the $TNX 10 year treasury note index has gone from 50 to 30. Here too the long term moving average is above the other two moving averages and price.
When one looks at the raw data, gold is not only the best performing mainstream asset class for the past 3 years, it is the best performing asset class of the decade, and is leading the pack so far for the 21st Century. GOLD IS UP four fold this decade from 250 to 1000. Yet, you hardly hear about it in mainstream media, though that is discussion for a future article.
The bottom line to all of this is that GOLD has been and should it break out here will continue to lead the way in terms of capital appreciation. For while gold on a daily basis did breakout to new high ground, it has not yet done so on a weekly basis. Let’s take a look at the weekly chart so you can see what I’m talking about.
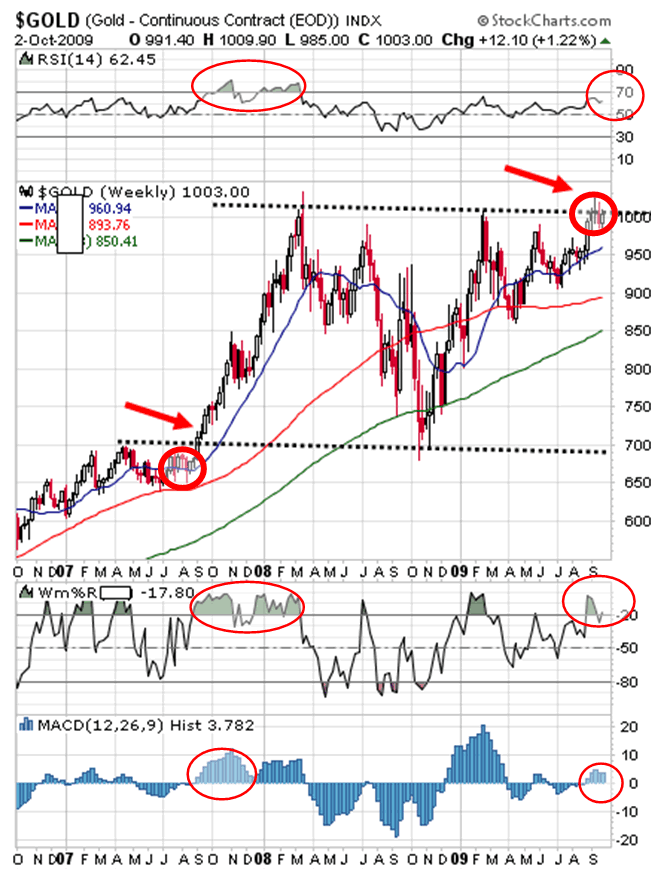
The chart below is a weekly chart of gold for the past three years. As you can see by the dotted sideways black channel lines on this chart, gold has not broken above the top dotted black channel line at the 1000 dollar area yet as it did in September of 2007 when price exploded through the black dotted bottom channel line at the 700 area.
So what do we look for to confirm that gold has a breakout?

First off let’s look at the 2007 action just before and after the major breakout to see what is similar.
Then and Now
THEN: In 2007, gold consolidated just under the bottom black dotted channel line for about 6 weeks before making its breakout move up. (See fat red circled price of 2007)
NOW: In 2009, gold is consolidating just under the UPPER black dotted channel line and is in it’s fifth week of doing so. (See fat red circled price of 2009.)
THEN: In 2007, the RSI indicator (at the top of the chart) never once fell below the 50 area on the weekly chart.
NOW: In 2009, the RSI indicator (at the top of the chart) never once (so far) has price fallen below the 50 area on the weekly chart.
THEN: MACD HISTOGRAM (at the very bottom of the chart) came out of the below zero reading and started putting in positive bars. (see red circled area)
NOW: MACD HISTOGRAM (at the very bottom of the chart) has come out of the below zero reading and is putting in positive bars. (see red circled area)
THEN: The initial 6 week consolidation we spoke about earlier occurred in the August/September timeframe.
NOW: The initial 5 week consolidation we are going through now is occurring during the same seasonal timeframe.
Conclusion: GOLD IS AT THE APEX OF A MAJOR BREAKOUT AGAIN.
What Next?
In this section, lets us now take a look at what WE NEED TO SEE if this is a genuine breakout.
- We need to see price move above the upper black dotted channel line and we need to begin to see higher lows on a weekly basis and we need to move above the 1040-1075 area to confirm the breakout price.
- We need to see the MACD HISTOGRAM indicator listed at the bottom of the chart to continue to PRODUCE higher bars during the initial phase of the breakout. (disturbing was last weeks bar that was lower than the previous weeks) A failure to produce higher bars while gold is rallying in breakout fashion will warn that the breakout might be limited in price appreciation.
- We need to see the WILLIAMS %R indicator just under price remain above the 80 area.
- We need to see the RSI indicator at the top of the chart continue higher and even enter the 70 overbought area once the breakout is under way.
- Although covered a bit by the red circled area in 2007, price NEEDS to have a thrust above the upper channel line when it breaks out. A 50 or 75 weekly dollar rally should do it.
- We need to see the GOLD STOCKS participate if this is a true breakout.
- We need to see a PRICE PATTERN that is consistent with an impulsive move. Before the breakout in 2007 price was in a choppy and overlapping price pattern. ONCE the breakout occurred…………the price pattern became impulsive and price did not overlap. It just kept going higher from week to week. Today we’ve been through a massive choppy pattern over the past year. IT MUST end when we break above the top black dotted channel line. Choppy patterns are not typical of real strong breakouts. This current timeframe needs to exhibit the same characteristics.
- We need to see price remain above the short term blue moving average on the chart.
BOTTOM LINE:
Going forward, it’s simple. We need to see gold break above the upper black dotted channel line, and once that occurs we need to see confirmation in price patterns, overbought indicators, and gold stock participation to some extent. We need to see LONGER weekly price ranges and they need to continue up in a steep methodical advance.
In conclusion, gold bugs need to see a rally beyond the 1035-1070 area in gold and then we need to keep an eye out for the eight things I have listed above to ensure that the rally will have staying power.
At Goldtrends, we follow all the timeframes of the gold market right down to the hourly trend. We are currently monitoring the potential for a weekly medium term breakout. Gold has established the PRICE points at which the "odds" will tilt to the upside or the downside. If you like to follow along with us as we watch PRICE confirm when the next major trend begins, then drop by the website (where registration is not required) and check out ALL of the gold and silver analysis provided there for your review.
May you all prosper.
Bill Downey
Bill Downey is an independent investor/ trader who has been involved with the study of the Gold and Silver markets since the mid 1980’s. He writes articles for public distribution for other newsletters and websites as well as his own free site at: http://www.goldtrends.net/
Email: Goldtrends@gmail.com
© Copyright Bill Downey 2009
Disclaimer - The opinion expressed in this report is the opinion of the author. The information provided was researched carefully, but we cannot guarantee its total accuracy. The report is published for general information and does not address or have purpose or regard to advise specific investments to anyone in the general public. It does not recommend any specific investment advice to anyone.
© 2005-2022 http://www.MarketOracle.co.uk - The Market Oracle is a FREE Daily Financial Markets Analysis & Forecasting online publication.


