


Stocks & Commodity Markets Technical Analysis: Secrets to Success
Stock-Markets / Financial Markets Jun 30, 2007 - 02:00 PM GMTBy: Dominick

Did you lose money last week while other traders used the market like a blank check? Did you give into the doom and gloom and short the opening Wednesday morning to just watch the market drain the cash out of your account? Did you make the same mistake during Friday's summer feast, just before the market recovered 13 points in 30 minutes?
If so, you'll be interested in learning the secrets to our success at TradingtheCharts.com, where the traders are unbiased and price action rules.
What do I mean by unbiased? It's a simple concept -- we don't marry long term outlooks or analyze markets based on what we need to see so we can realize profits on our positions. No, we just trust the market to always be right and listen to the setups the charts provide.
A biased trader probably saw every rally this week as a must sell. After all, look at all the bad news, from the Bear Sterns debacle to the end of the quarter and the foiled terrorist plot in London . But a bear market would have been down a lot more.
No, this market seems to escape the trap door no matter what's being thrown at it. Besides, are you trading Bear Sterns or the ES? I've posted a monthly chart of Bear Sterns for weeks now, long before last week's news got to your screen or on the tape. The chart was showing that some type of news was about to come out of it.
But since we are trading the S&P, I'd rather know where that's going, not Bear Sterns or the China ETF. Remember that low in March, when the blame was on China ? Take a look at that ETF now – it's screaming to all time new highs and not a peep from the trading community.
Beside the S&P, I, like many others, watch a variety of markets. Like the NDX. Remember that theory that the NDX leads? Even if you don't like the idea, would you agree that we couldn't have seen the NDX scream to new highs this past week as the S&P collapsed? OF COURSE NOT! Well, looking for the S&P Futures to break the 1490 area with the NDX in a w4 was expecting exactly that.
Even if you aren't a member and privy to our daily analysis of dozens of markets, real time trade-oriented chatroom, and proprietary trend cycle charts, many at least had access to the chart below through our “Chart of the Week” feature.
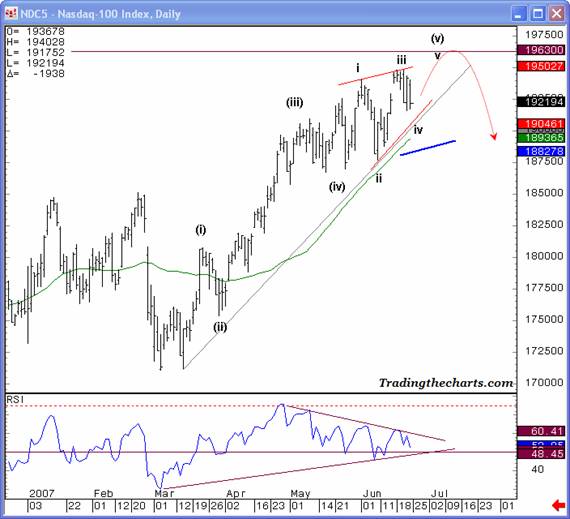
Even with this chart available to the entire world for free, many analysts and traders focused on the double top in place in the S&P. For some reason, cynicism has become en vogue, predicting a crash is the “in” thing to do, and preaching doom and gloom sounds wise. Maybe that day will come, but what I was seeing in this chart, and unbiased traders along with me, was a clear wave 4 pullback. Anyone who wanted make money was getting ready to buy!!
As I said last week, part of being unbiased is knowing when the count's wrong. In this case, the blue line is there to get us out. But, as it turned out we saw a perfect wave iv low this week as they opened the trap doors in the S&P on Wednesday to let uneducated traders “short the hole”. Wednesday's opening was the c wave bottom we were looking at exactly the price level we were looking for it. Buying that bottom allowed us to relax and watch the market make us money.
Not shorting the hole has been the biggest lesson that members have finally learned. It sure wasn't easy to break that bad habit but after seeing the results of the last 30 or 40, they now trade it professionally. When the time comes there will be a hole to short and stay short. We haven't seen it yet but I sense it will come soon. Here is one of many emails that shows the excitement of a member after this week's action.
Hi Dom...just a quick line to say... AWESOME.... This place gets better and better,,,your charts and calls are something else...The biggest lesson for me has been "don't short the hole"...that was always my downfall... Many thanks for all your hard work ..take care Regards Ash”
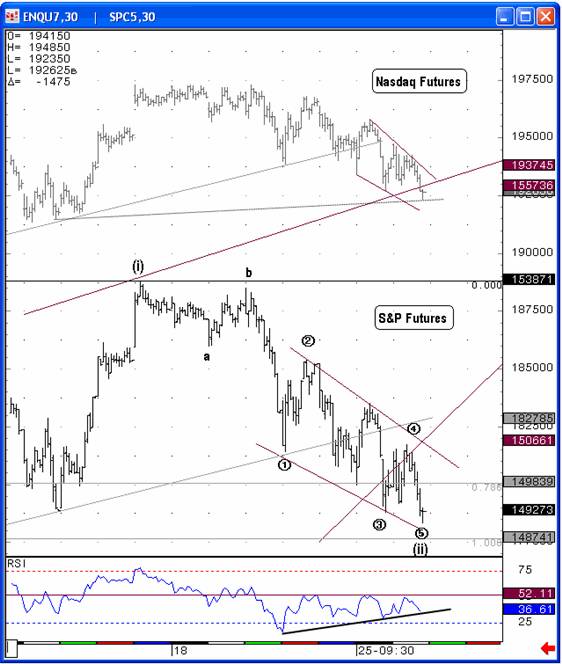
It really can be this simple, folks. The chart below is what I posted for members to show that while the S&P was exaggerating the downside and getting people out of long trades, the Nasdaq was shaping up nicely and suggesting another upside move for the whole market. This flexibility to trade only markets that offer clear risk/reward setups is another highlight of our Elliott wave based, unbiased technique.
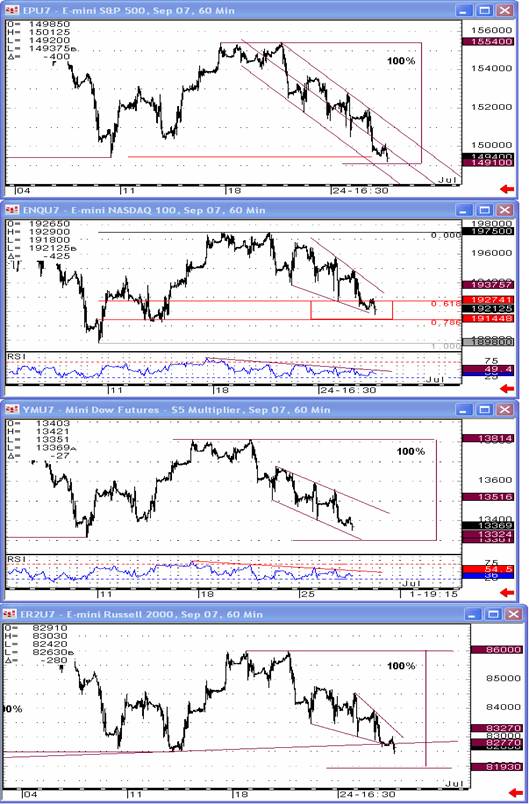
Wednesday morning we had this large spread created between the S&P futures and cash because of the late Tuesday selloff. After a two hour nap, the TTC community took its membership privileges “up a notch” by staying up all night trading and charting along with the community we have created. It was actually fun, quite rewarding, and I'm sure they didn't mind the confidence that was being shown.
The charts below were what we focused on, and they sure did paint a much different picture than what was being presented by the media, newsletters or forums. We were looking to buy support into the open as others were selling into the idea of a crash.
After all, all I was doing is staying on the maps that we have been following since the March lows. Don't believe it? We gave it to you in this free update last week.
The following are a few lines from that update that clearly show where I think the market was heading in the early week, but more importantly, what we would do once there:
After calling the market perfectly from the June 2006 low all the way to the June 1st 2007 turn, right down to the exact date, I could just step back and say the top is in and that I told you first. Unfortunately, I have too much reason to believe the ingredients for a perfect top are not yet in the mix but still out in front of us to simply ignore it and walk away. As of this weekend the confirmation needed isn't there. If it appears early next week I will be fast to work on bearish patterns, but not until then.
To sum things up, as I've said before, markets can turn on a dime and I can't promise you right now anything more or less than that if there's confirmation of a top next week, then I'll see it. In the meantime, I'll be looking for an aggressive long in the early part of the week with a close line in the sand to indicate if I'm wrong. Of course, those levels are reserved for our members.
That closing line was just under 1491 in the S&P futures. The actual low on Wednesday was 1492! After buying the market at those lows, the only sell signal was into the close. It was more of a money management idea than a sell signal. After just being rewarded with a 25-point turnaround, while other traders continued to sell each higher tick that day, we took the money and ran. We banked a huge profit and were now ready for Bernanke the next day.
Another huge benefit was to have one of our resident cycle members point out that his expected turn was due Wednesday morning, right at the open. Wow, as Hannibal used to say on the A-Team, “I love it when a plan comes together.”
Coming out of those lows Ian posted this:
“ The 56 Hour Cycle Lows came right at the Open, but we're not out of the woods yet, as downtrend channel Resistance comes in at 1500SPX/1513 Sep SP area. Ideally these Lows should be retested in the next day or so, before we really start the rally phase.
Ian”
So, this week Cycles, Elliott, Fibonacci, and the trend charts all teamed up to pull together another very profitable week. Not only did Ian get his exact low, but Friday could have been the “retest.”
Going forward will be more of the same, trading this trader's paradise. We already won on an excellent trade Wednesday that may have replayed itself on Friday, when the late day selloff forced seasoned members that were comfortable with a riskier and fast trading environment to go long a few points off the lows. That position is already in the green, but if we rollover on Monday morning and confirm a top was in, we'll be ready to put on the bear suit. But, baring any news timebombs next week, we don't think that'll be the case.
Now that you've had a small peak at how we do it, are you interested in learning about our setups for next week? Maybe you want to study our Weekly Maps, or examine the proprietary trend charts The good news is that you can do that and much more right now by joining TTC. As I've been saying in this space for weeks, TTC will raise its monthly subscription fee to $89 this Sunday, July 1 st , 2007 . But even this price is nothing compared to the money-making potential our members enjoy every month. As we continue into the summer, this weekly update may become somewhat irregular, but it never contains the up-to-the-minute information we have at the site. The only way to get the unbiased analysis and realtime trade updates is to join now!
Members
Be sure to visit the Weekly Maps. As many of you know, the Weekly Maps section of the site is where I lay out the big picture ideas for the following week along with charts from any other markets that seem to be playing a part in what we trade. And TRUST ME, next week is important!
Also make sure you are aware of TTC's new addition to help many keep an eye on the Forum updates without needing to constantly login to check. We made this neat feature that you open to your desktop and you will be able to see when someone posts, and who is posting. There are some handy links there as well as a small time frame trend chart. I'm sure I'll find other things to add to it.

Non Members
Today is the LAST DAY at the original fee.
We work hard for our continuously profitable setups and they've been more than proven in the seemingly unbelievable results published in this free update for well over a year. At $50/month the current price of joining our trader's paradise is really not an issue, especially considering this discount price is only available for 1 more day! I have mentioned the increase for months and starting July 1st it will be $89 a month. Current members and anyone that joins before the increase takes effect will not be subject to the new price, and will continue paying the current $50 subscription fee on a month-to-month basis. So, if you have been thinking of joining, this is a great time.
Plus, since the refundable fee works out so well I will have it available until July 1 st so that anyone thinking about joining will then also be joining under the grandfathered rate of $50 Join before July 1 st , 2007 and if you don't like it after a full week's try, send me an email asking for a refund, No questions asked.
Have a profitable and safe week trading, and remember:
“Unbiased Elliott Wave works!”
By Dominick
For real-time analysis, become a member for only $50
If you've enjoyed this article, signup for Market Updates , our monthly newsletter, and, for more immediate analysis and market reaction, view my work and the charts exchanged between our seasoned traders in TradingtheCharts forum . Continued success has inspired expansion of the “open access to non subscribers” forums, and our Market Advisory members and I have agreed to post our work in these forums periodically. Explore services from Wall Street's best, including Jim Curry, Tim Ords, Glen Neely, Richard Rhodes, Andre Gratian, Bob Carver, Eric Hadik, Chartsedge, Elliott today, Stock Barometer, Harry Boxer, Mike Paulenoff and others. Try them all, subscribe to the ones that suit your style, and accelerate your trading profits! These forums are on the top of the homepage at Trading the Charts. Market analysts are always welcome to contribute to the Forum or newsletter. Email me @ Dominick@tradingthecharts.com if you have any interest.
This update is provided as general information and is not an investment recommendation. TTC accepts no liability whatsoever for any losses resulting from action taken based on the contents of its charts, commentaries, or price data. Securities and commodities markets involve inherent risk and not all positions are suitable for each individual. Check with your licensed financial advisor or broker prior to taking any action.
Dominick Archive |
© 2005-2022 http://www.MarketOracle.co.uk - The Market Oracle is a FREE Daily Financial Markets Analysis & Forecasting online publication.