


Commodities Continued Upward pressure
Commodities / CRB Index Jun 30, 2007 - 04:09 PM GMTBy: Donald_W_Dony
 KEY POINTS:
• CRB Index continues to slowly turn up
• Oil hits resistance level at $69 to $70; July
should begin seasonal uptrend to target
• Natural gas remains pinned under $8.25
level; testing January/2007 lows
• Broad consolidation for gold above $640;
support throughout the summer
• Base metals develop short-term easing of
prices in July; main trend is still up
into July.
The Commodities Research Bureau (CRB) Index has
stubbornly remained in a trading band underneath the 320
level since February – and this should come as no great
surprise. Energy, which equates to almost 40% of its total
weighting, has mixed signals. Oil is just now just finally
inching out of its usual May and June consolidation pattern
(see Chart 2 on page 2), but natural gas remains pinned
under $8.25 as supply pressures outstrip demand. Gold,
too, has also slid sideways for five months. This is mainly
due to the current stability of the U.S. dollar. Only industrial
metals have methodically advanced during this time period.
Even with this price restraining, it is evident that the CRB
Index wants to continue muscling its way higher, moving
into July. This is one train that is still on a roll.
The big turn
If readers will remember, back in the May issue, I
mentioned that the CRB (Chart 1) appeared ready to jump
past the 320 hurdle. This did not occur. Instead, prices
continually teased this line, as buying pressure mounted.
This key level is particularly important, ecause the market
established it during the past two years as a prime junction
between a bear and a bull market. Repeatedly, prices have
either bumped up to it and fallen back, or declined down to
it and bounced upward.
The fundamentals for higher prices are certainly in place. Global demand is relentlessly tightening the vise on supply,
as world economies expand in an environment of low
interest rates and broad liquidity.
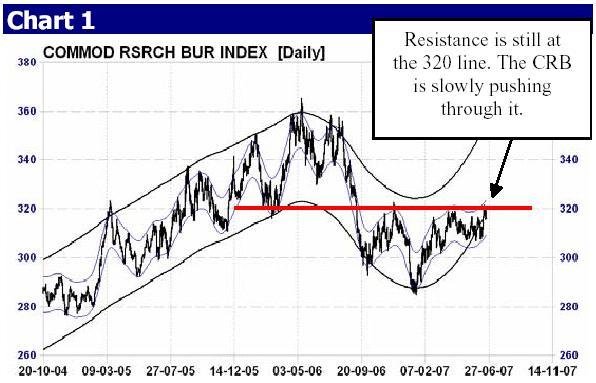
Once 320 has been broached, technicals point to 355 as the first target. But will July be the date of the crossing? That answer will
only come from the largest component of the CRB – oil.
Seasonal pattern in place
Oil is clearly the world’s most-traded commodity. More
contracts are crossed per month than for any other
tangible. With so many people voting with their money, it
should not be surprising that a repeating trading pattern
develops.
In Chart 2 (on the next page), we see that oil normally has an annual price low in December or January and a peak in August and September. Along the way, there is usually sideways consolidation in May and June, with July as the month of the big breakout. This year appears to be no different than in the past.
Oil surged over the $67 resistance level late in June, along with strong buying pressure. With this rupture out of the two-month consolidation, $69 to $70 will be the next resistance line to cross (see Chart 3 on page 2). With the normal seasonal price peak in August or September, I think that there is little reason why oil will stay below this level over the next few months.
Oil can be expected to find some overhead resistance at the $69-to-$70 zone in July, with a price target during this
This is the first page of the July issue. Go to www.technicalspeculator.com and click on member login to download the full 14 page newsletter.
By Donald W. Dony, FCSI, MFTA
www.technicalspeculator.com
COPYRIGHT © 2007 Donald W. Dony
Donald W. Dony, FCSI, MFTA has been in the investment profession for over 20 years, first as a stock broker in the mid 1980's and then as the principal of D. W. Dony and Associates Inc., a financial consulting firm to present. He is the editor and publisher of the Technical Speculator, a monthly international investment newsletter, which specializes in major world equity markets, currencies, bonds and interest rates as well as the precious metals markets.
Donald is also an instructor for the Canadian Securities Institute (CSI). He is often called upon to design technical analysis training programs and to provide teaching to industry professionals on technical analysis at many of Canada's leading brokerage firms. He is a respected specialist in the area of intermarket and cycle analysis and a frequent speaker at investment conferences.
Mr. Dony is a member of the Canadian Society of Technical Analysts (CSTA) and the International Federation of Technical Analysts (IFTA).
Donald W. Dony Archive |
© 2005-2022 http://www.MarketOracle.co.uk - The Market Oracle is a FREE Daily Financial Markets Analysis & Forecasting online publication.