


Early Signals of a Maturing Stocks Bear Market Rally
Stock-Markets / Stocks Bear Market Oct 14, 2009 - 03:21 AM GMTBy: Garry_Abeshouse

 In my last posting I mentioned that some important bellwether charts peaked on or prior to the first week of August, 2009.
A survey of daily price charts of 199 Global Fortune 500 non finance companies showed that 59% actually peaked on or prior to the first week of August. For Banks, Finance and Insurance stocks (74) this percentage actually increased to 64% This means a clear majority of these large companies, almost 2/3, refused to follow the main US indexes to new market highs up on average about 13% +.
While many of these stocks actually fell during this time, the Nasdaq 100 rose 16%, DJ 30 Indust. rose 12%, S&P500 13%, Global Dow leaders Index 13%, European Top 100 Index 13%, FTSE 16%, ASX All Ords 18%, JP Morgan Chase 20%, Goldman Sachs 27%, Apple 31%, BHP 13% (NYSE), Westpac 46% (NYSE). These figures were calculated from the May to July peak to the current peak.
So you can see that the main US, European and Australian stock market indexes and the rises of some of the market leaders leading over the last two months did not really reflect the market action of nearly 2/3 of the some of largest companies in the world.
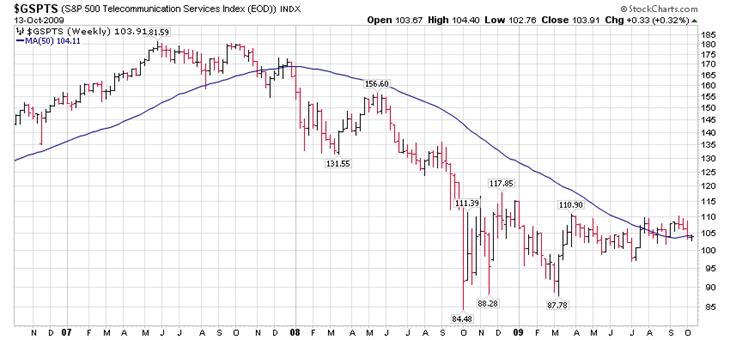
What are they trying to tell us: Charts that failed to make new highs after the first week of August, 2009.
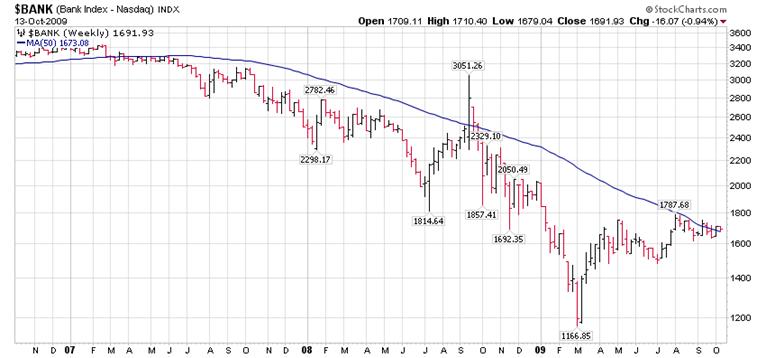
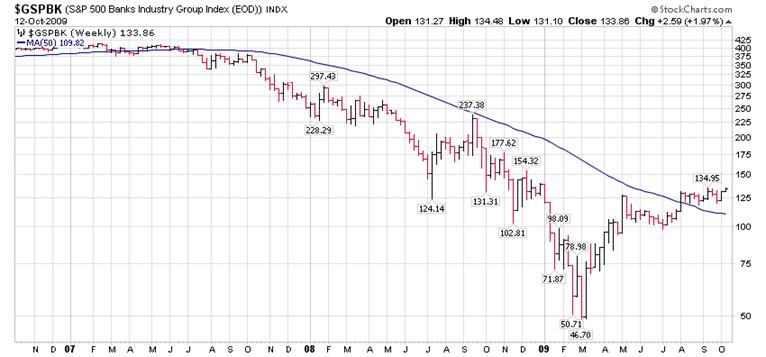
The charts below have been selected due to their importance as bellwethers of weakness, indicating that the rally in equities is running out of steam.
These charts also are acting as indicators of where the weakest links in the US economy could be and which sectors are most likely to be the weakest links that will quickly turn green shoots brown.
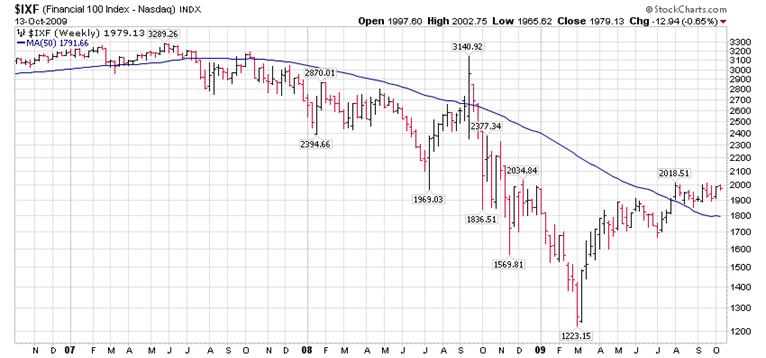
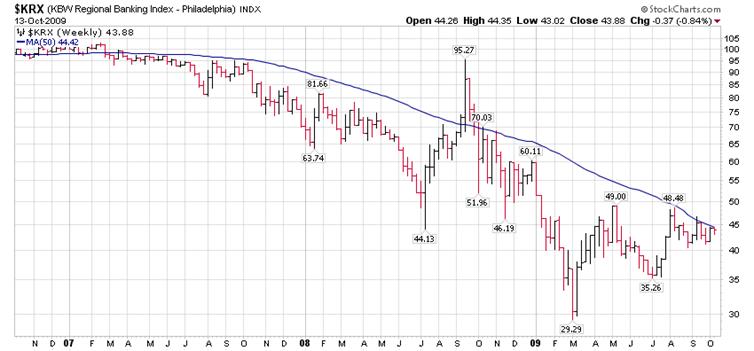
In the Finance sector, the Philadelphia Regional Banking Index, the Nasdaq Banking Index, Nasdaq Financial 100 Index and the S&P 500 Banks Industry Group Index all appear to mirror the results of my chart survey above. It should be noted that other finance indexes not included here had very small rises only, nothing like the moves mentioned above in the composite indexes, more in the region of under 6%.
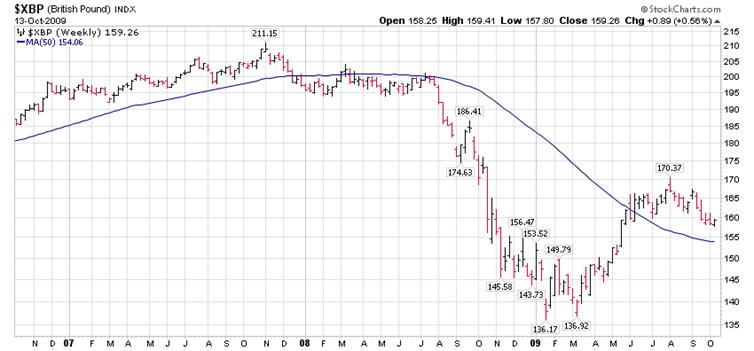
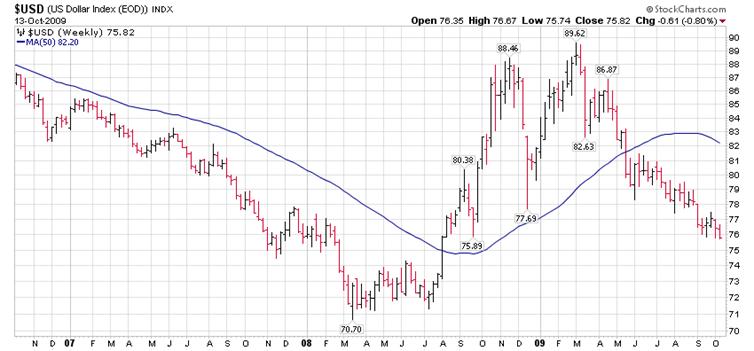
As shown in my previous post, the Pound Sterling, accustomed to paralleling the moves of the equity markets over the last two years at least is faltering also, while the USD actually moves counter to the moves in equities.
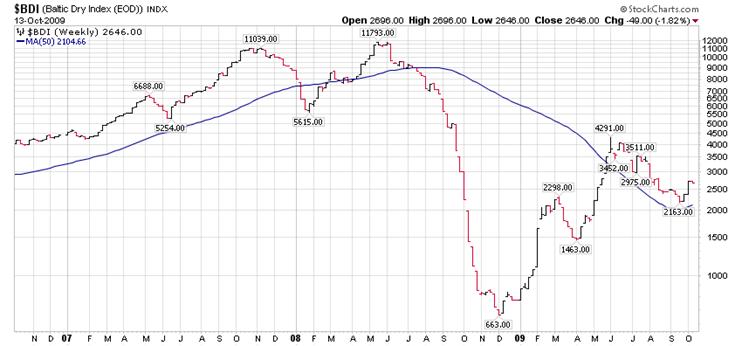
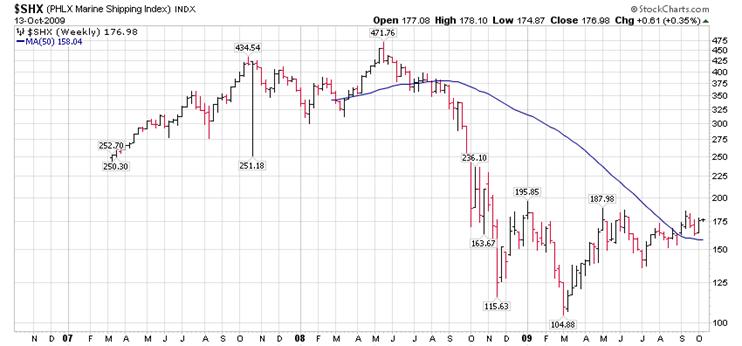
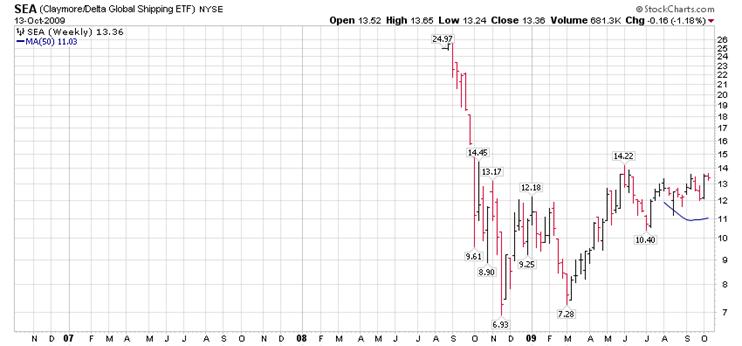
It is interesting that three important shipping indexes all peaked in May/June – not a bullish sign.
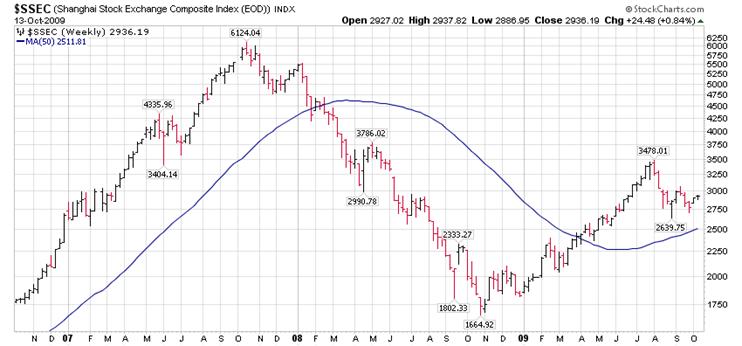
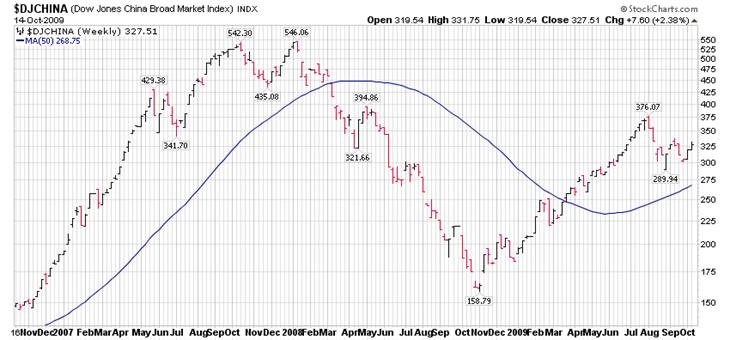
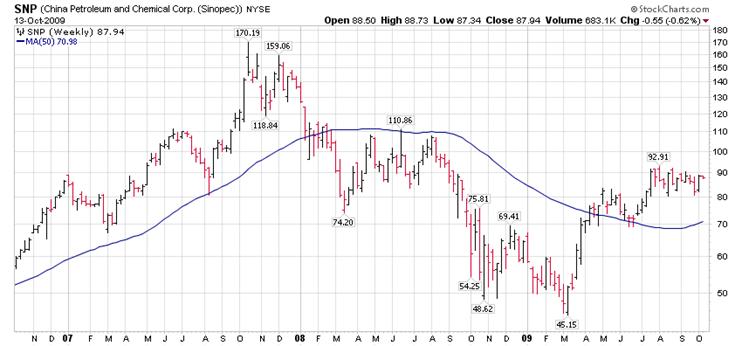
For those banking on China to pull us out of an financial morass, their market failed to rise over the last few weeks.
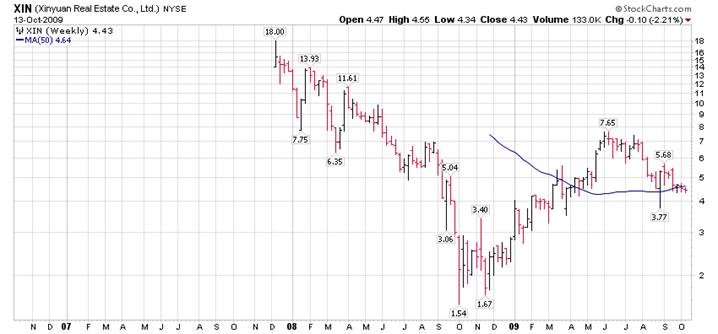
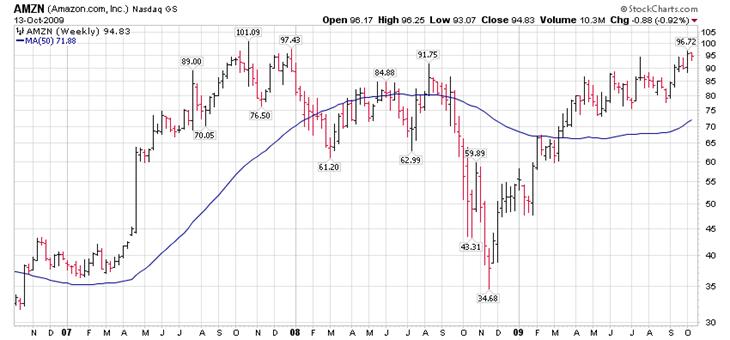
The following are other examples of failing to participate in the last stage of the rally in equities, some of which are quite surprising.
The fact that Amazon is testing its 2008 high and is not far off its all time high suggests in itself that the market has reached a dead end.
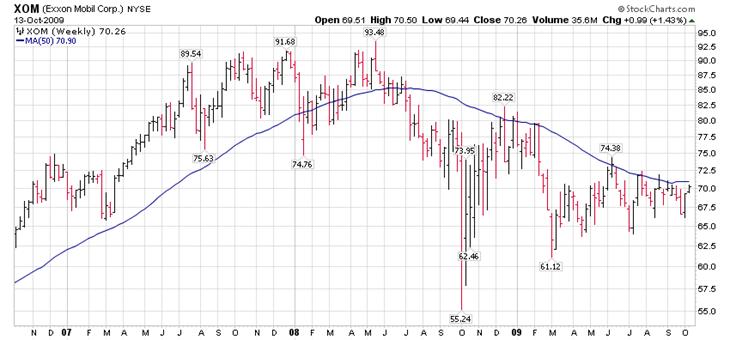
ExxonMobil is the worlds largest publically traded company by capitalization and one of the largest oil companies in the world.
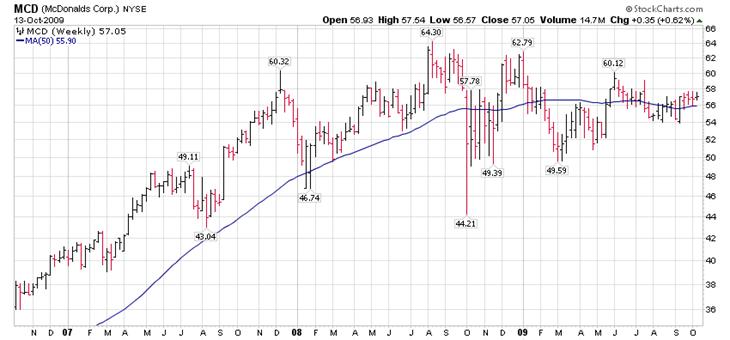
And who would have thought that Maccas would be a poor performer in these economic conditions.
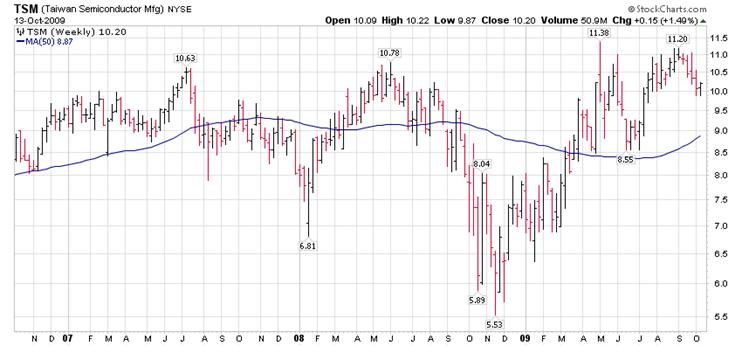
Taiwan Semiconductor has the largest independent semiconductor foundry in the world, making logic chips for many of the large computer companies.
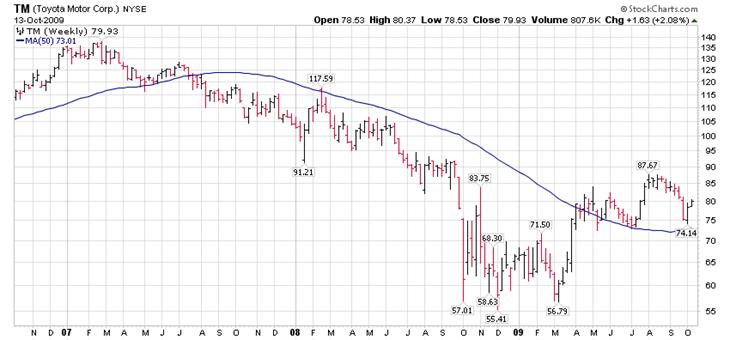
Toyota is the largest automaker in the world.
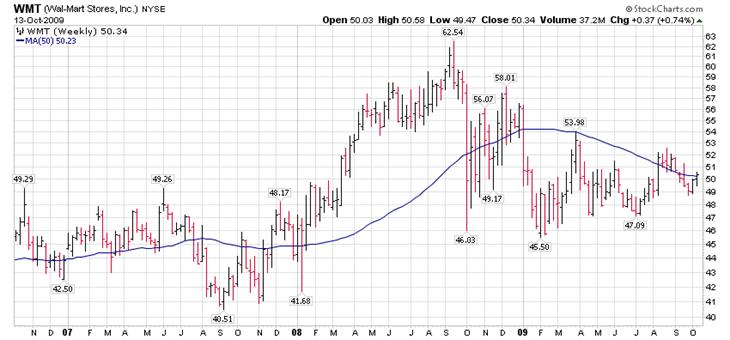
Wal-Mart’s chain of large discount department stores is the largest corporation by revenue (2008) in the world.
Till next time.
Garry Abeshouse
Technical Analyst.
Sydney
Australia
I have been practicing Technical Analysis since 1969, learning the hard way during the Australian Mining Boom. I was Head Chartist with Bain & Co, (now Deutsch Bank)in the mid 1970's and am now working freelance. I am currently writing a series of articles for the international "Your Trading Edge" magazine entitled "Market Cycles and Technical Analysis".
I have always specialised in medium to long term market strategies and after discovering the excellent Point & Figure Charts from Stockcharts.com in mid 2008, have concentrated on this style of charting ever since.
© 2005-2022 http://www.MarketOracle.co.uk - The Market Oracle is a FREE Daily Financial Markets Analysis & Forecasting online publication.