Inflation and Government Deficits, Milton Friedman's View
Economics / Inflation Oct 17, 2009 - 01:32 AM GMTBy: Paul_L_Kasriel
 Before getting started on this month's essay, I would like to say something about last month's chart show. I received a number of favorable comments about the different format. I have to admit that my ego was bruised a bit. I thought you liked my prosaic prose. My ego notwithstanding, I will try to give the customers what they want more often - just not every month. The reason for not providing a chart show every month is that not enough changes that frequently to warrant such. So, this month you are stuck with the prosaic prose. And because not that much has changed from last month save for stronger-than-previously expected consumer spending in the third quarter, I am going to discuss two issues that are getting a lot of ink of late rather than spending time discussing the updated forecast.
I never had the privilege of studying under Milton Friedman. I did, however, have the privilege of being a colleague of one of his brightest students - the late Robert (Bob) D. Laurent. Through Bob, I learned that Milton Friedman believed inflation to be a monetary phenomenon and the real cost of government was not how the government raised its funds - taxing, borrowing or printing - but how many funds the government raised. Inflation and federal government deficits are "hot" topics these days. So let's discuss these topics within a framework of what I assume Milton Friedman would have approved of.
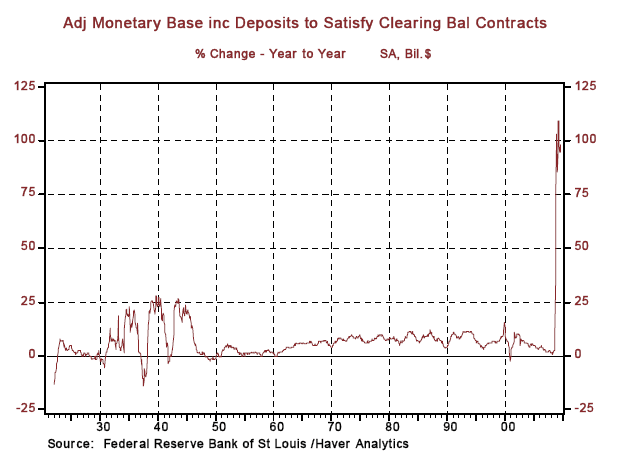
I continue to hear that the Fed has sown the seeds of inflation by inflating its balance sheet. The monetary base - currency held by the public (banks and nonbanks) and reserve balances held by depository institutions at the Fed - accounts for the largest portion of liabilities on the Fed's balance sheet. Chart 1 shows that the monetary base mushroomed from $936 billion in September 2008, the month in which Lehman Brothers failed, to $1.8 trillion in September 2009. On a year-over-year basis, this represented an unprecedented 94% increase in the monetary base (see Chart 2). Is this what Milton Friedman was talking about when he referred to inflation being a monetary phenomenon?
Chart 1
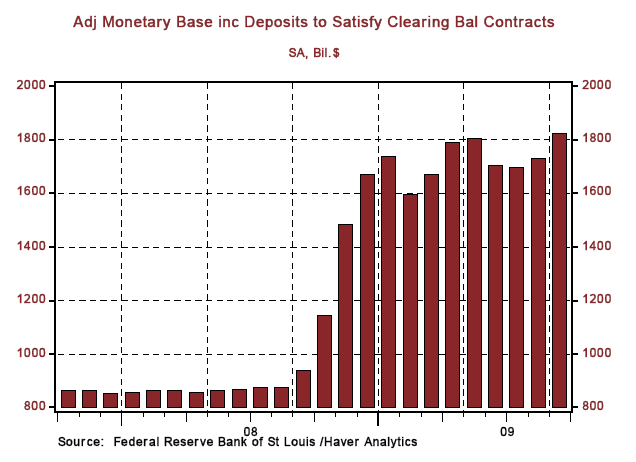
Chart 2
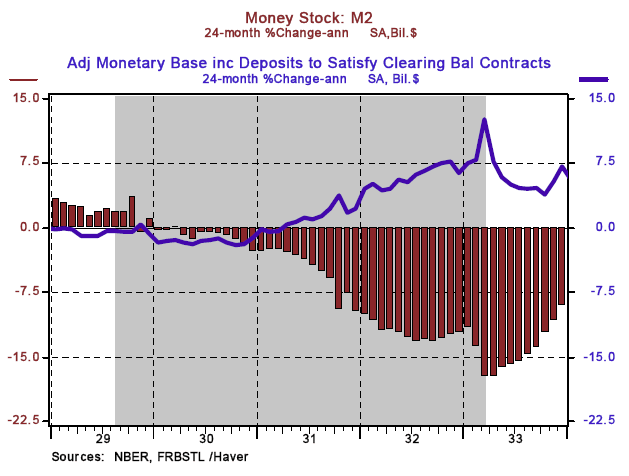
No. Friedman's inflation monetary phenomenon was related to the growth in the money supply held by the nonbank public, not the monetary base. After all, the monetary base soared in the early 1930s, albeit not to the extent that it did in the past year, even as the M2 money supply contracted at double digit rates (see Chart 3).
Chart 3
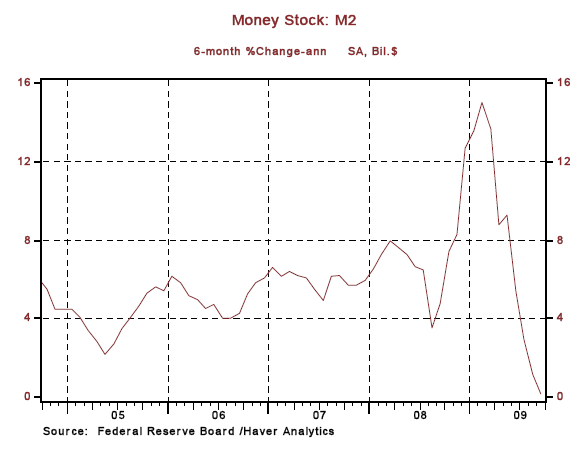
In the six months ended February of this year, M2 grew at an annualized rate of 15.1%. This certainly would have raised Friedman's inflationary antennae. But in the six months ended September, M2's annualized growth had slowed to only 0.2% (see Chart 4). Although the annualized rate of growth of M2 in the 12 months ended September is a relatively high 6.7 %, if M2 remains on its recent six-month course, the year-over-year growth rate will moderate to a much less threatening inflationary pace.
Chart 4
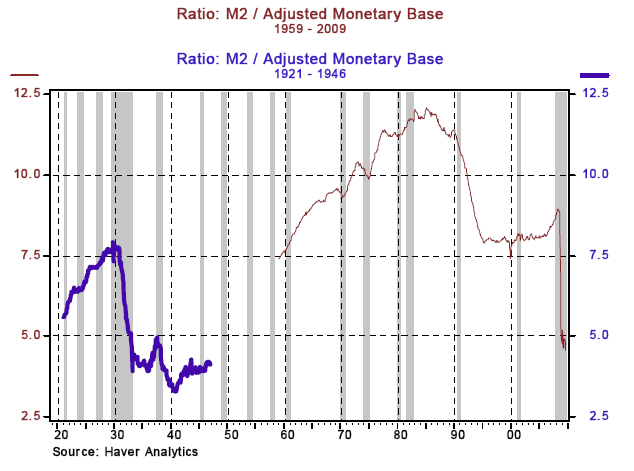
It is interesting to compare what has happened in the past year to the relationship between the M2 money supply and the monetary base with how this relationship behaved in the early 1930s. Chart 5 shows the ratio of M2 to the monetary base for the periods in which data are available - 1921 through 1946 and 1959 through the present time. This ratio fell from a recent high of 8.9 in April 2008 to a low of 4.6 in September 2009 - a decline of 48%. Similarly, after hitting a high of 7.8 in March 1930, the ratio of M2 to the adjusted monetary base fell to 3.9 in March 1933 - a decline of 50%. If ever the concept of "pushing on a string" had any validity, it did in the early 1930s and does today with regard to the Fed's efforts to balloon its balance sheet while only resulting in a relatively small increase in the broad money supply held by the nonbank public. Milton Friedman did not judge the growth in the monetary base in the early 1930s to be inflationary and it is doubtful that he would judge the recent explosion in the monetary base to be inflationary either given the lack of response in the broad money supply.
Chart 5
Now, to "channel" Friedman with regard to federal deficits. As mentioned at the outset, Friedman viewed the real cost of government to be related to how much the government spent, not how big the deficit was. Friedman realized that just as the Northwest Mounties always get their man, the federal government always gets its funds. The more funds the government acquires, the more productive resources it controls and/or directs. Given a finite amount of productive resources at any point in time, the more resources under the control of the government, the fewer resources will be left to be used by the private sector. As you will see the importance of it in a minute, the economy's long-run potential growth rate basically is related positively to the growth in the labor force and the growth in the productivity of that labor force.
Let's assume that an increase in government spending will be used to acquire resources for the provision of health care for retirees. Retirees, by definition, are no longer part of the labor force. Although a healthier senior population might result in lower golf scores for this cohort, it does nothing to increase the productivity of the current labor force. Thus, this increase in government spending does not positively affect the long-run rate of growth of the economy. It could conceivably negatively affect the long-run rate of growth in the economy. Remember, that the more resources controlled by the government implies fewer resources controlled by the private sector. If the increased government spending on retiree health care comes at the expense of business spending on capital equipment and R & D, then the productivity of the current labor force will be adversely affected and so, too, will the long-run growth rate of the economy. Now, if the resources commandeered by the government were otherwise going to be used by households for R & B or some other forms of consumption rather than by businesses for R & D, then the increase in government spending would have a less negative impact on long-run economic growth than otherwise. But to reiterate, in Friedman's view and mine (who am I to argue with Milton Friedman?), the real economic issue is not the amount of the federal deficit, but rather, the amount of federal government spending.
Why did I choose federal government spending on retiree health care as the example of the increase in government spending? Because this is the main driver of the projected explosive increases in federal government deficits and spending in the "out years." Regardless of how this spending gets funded - increased taxes, increased federal borrowing or increased printing of "money" - if it occurs as projected, the long-run rate of growth of the U.S. economy will be negatively affected.
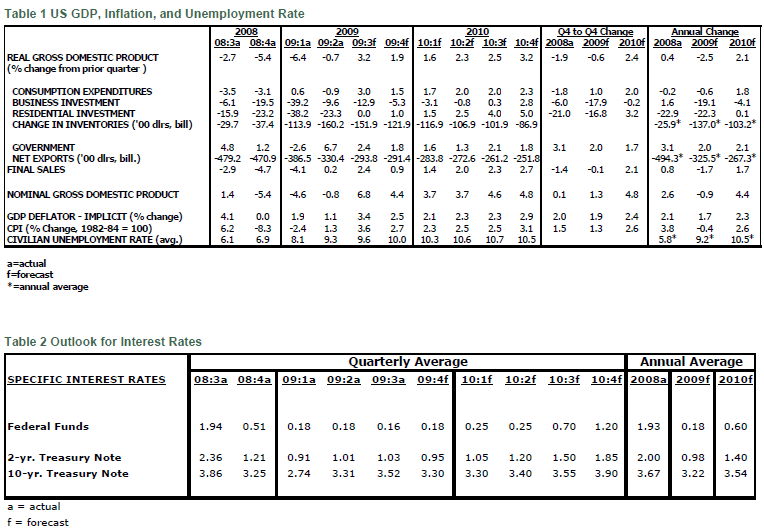
The updated economic and interest rate forecasts are contained in the tables below. The only major change to the GDP forecast is a bump up in Q3:2009 growth from 2.5% last month to 3.2% this month due to a stronger forecast for consumer spending. The major change to the interest rate forecast is somewhat lower Treasury bond yields for the rest of this year and 2010. Why lower bond yields? Nothing fundamental. I just appear to have been too bearish on bonds compared to those who set the yields on bonds - market participants. To paraphrase Keynes, when the facts change, I change my forecast.
*Paul Kasriel is the recipient of the Lawrence R. Klein Award for Blue Chip Forecasting Accuracy
THE NORTHERN TRUST COMPANY ECONOMIC RESEARCH DEPARTMENT October 2009 SELECTED BUSINESS INDICATORS
Paul Kasriel is the recipient of the 2006 Lawrence R. Klein Award for Blue Chip Forecasting Accuracy
By Paul L. Kasriel
The Northern Trust Company
Economic Research Department - Daily Global Commentary
Copyright © 2009 Paul Kasriel
Paul joined the economic research unit of The Northern Trust Company in 1986 as Vice President and Economist, being named Senior Vice President and Director of Economic Research in 2000. His economic and interest rate forecasts are used both internally and by clients. The accuracy of the Economic Research Department's forecasts has consistently been highly-ranked in the Blue Chip survey of about 50 forecasters over the years. To that point, Paul received the prestigious 2006 Lawrence R. Klein Award for having the most accurate economic forecast among the Blue Chip survey participants for the years 2002 through 2005.
The opinions expressed herein are those of the author and do not necessarily represent the views of The Northern Trust Company. The Northern Trust Company does not warrant the accuracy or completeness of information contained herein, such information is subject to change and is not intended to influence your investment decisions.
Paul L. Kasriel Archive |
© 2005-2022 http://www.MarketOracle.co.uk - The Market Oracle is a FREE Daily Financial Markets Analysis & Forecasting online publication.


