Turning Bullish on Precious Metals
Commodities / Gold & Silver Jul 02, 2007 - 08:33 AM GMTBy: Jordan_Roy_Byrne
 Gold's divergence since April was and still is troubling. Despite that divergence, multiple different indicators are now signaling that the precious metal sector could be at or approaching a major bottom. Though gold did break its uptrend from October 2006, it has failed to breakdown in a manner that would deem significant its recent underperformance. Another term for a breakdown that doesn't follow through is "shakeout." The converse is when a breakout occurs but isn't sustained.
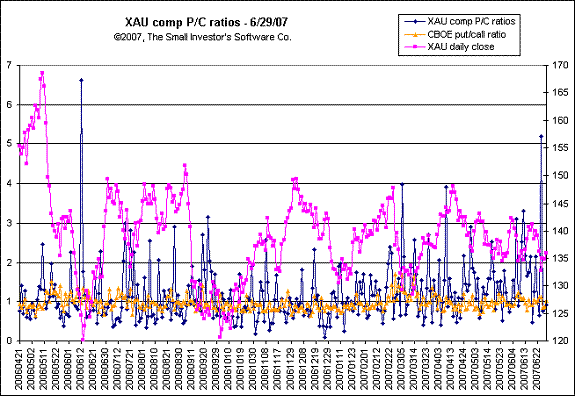
Let's start with sentiment. Weeks ago I posted a chart showing the total assets in the Rydex Gold fund and the price of the fund. We could see that the assets at that time, was considerably low given the price of the fund. Coincidentally, that level of assets usually marked a key bottom for the fund's price. Here is another measurement of sentiment:

Source: The Small Investor's Software Co.
The chart specifically highlights the put/call ratio for the options in the XAU index. If a trader is bullish he'll buy calls. If he's bearish he will buy puts. Thus, a high put/call ratio is evidence of bearish sentiment and serves as a great contrary indicator. As you can see, the last time the put/call ratio was in this territory, it was prior to the June 2006 bottom that produced a very strong rebound over the next few weeks and months. The current put/call ratio bodes well for a significant bottom to be in place.
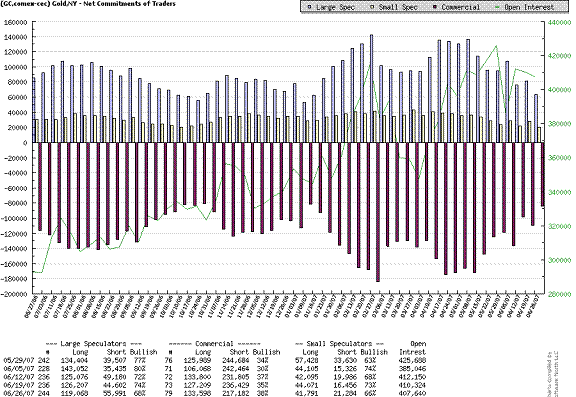
Next, here is the current Commitment of Traders (COT) Report:

This report has been moving in the right direction if you are a gold bull. The current data is similar to what we say at both the October and January bottoms. These bottoms, respectively, produced a 16% and 15% rise in gold over the following two months.
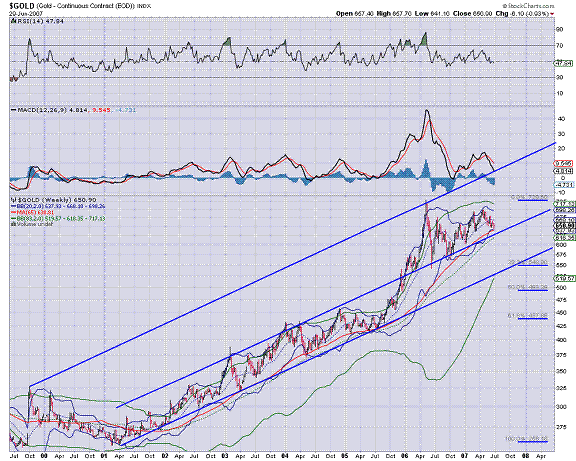
Now let's get to the technicals on gold. Here is a long-term weekly chart:

In this chart, I have included the following:
-20 Week Bollinger Bands
-83 Week Bollinger Bands (roughly equivalent to the 20 Month BBs)
-65 Week Moving Average
Currently, the lower 20-week lower band rests at $638, and the 65-week moving average sits at $639. Throughout gold's bull market, it has yet to close below both of the aforementioned gauges. Below that, sits the 20-month moving average at $618 and the middle trendline at about $628. Essentially, we see major support at $620 to $640.
Going forward, the single question is if that large support area holds up or will gold need to decline further before it breaks to new highs? It is technically possible that gold could decline to the $550-$575 area by the end of the year and still remain in a bull market of course. However, it is obvious that the majority of the evidence now sits in the favor of gold bulls.
What about gold lagging stocks and commodities? What about the newly exposed problems with Collateralized Debt Obligations (CDO's)?
Gold is a leading indicator and its recent decline could be interpreted as investors fearing a dryup in credit and liquidity. Credit and money growth in the US has been quite high, though in the past few months, the pace of growth has declined. However, as we have argued recently, it is precisely this kind of environment that is best for precious metals. An environment of declining to stagnant growth, declining growth in money and credit, and growing problems with hedge funds ultimately leads to reflation. Many analysts have said that gold will soar when the Fed tips its hand and cuts rates. Yes, and remember that markets are forward thinking. Precious metals should begin their next major advance before the Fed tips its hand.
That also portends to a falling dollar. The dollar's spring recovery has abated and in the coming weeks, will once again threaten that key 80 level.
HUI & XAU Analysis follows for Trendsman readers….
For more fundamental and technical analysis and to see our top picks and model portfolio, sign up for our free email newsletter on this page of our website:http://trendsman.com/?page_id=17
By Jordan Roy-Byrne
trendsman@trendsman.com
Editor of Trendsman Newsletter
http://trendsman.com
Trendsman” is an affiliate member of the Market Technicians Association (MTA) and is enrolled in their CMT Program, which certifies professionals in the field of technical analysis. He will be taking the final exam in Spring 07. Trendsman focuses on technical analysis but analyzes fundamentals and investor psychology in tandem with the charts. He credits his success to an immense love of the markets and an insatiable thirst for knowledge and profits.
Jordan Roy-Byrne Archive |
© 2005-2022 http://www.MarketOracle.co.uk - The Market Oracle is a FREE Daily Financial Markets Analysis & Forecasting online publication.


