


Natural Gas Market, What's Going On?
Commodities / Natural Gas Oct 21, 2009 - 06:44 PM GMTBy: Charles_Maley

 An era can be said to end when its basic illusions are exhausted – Arthur Miller (American Playwright)
There has been a fair amount of talk about the glut of Natural Gas on the market today and how full capacity storage could threaten us by the end of the year. This is a very interesting situation. We are running close to full capacity, yet natural gas prices refuse to go down. In fact, we have had quite a rally off the September lows, moving from slightly below $3.50 to $5.23, up just shy of 50% (November contract).
So what’s going on here?
According to Matt Badiali of Growth Stock Wire, “We store natural gas in old oil and gas fields, salt domes, and even aquifers. Old fields make up the largest volume of storage, about 81% of the 8.5 trillion cubic feet of capacity. Some of those require a certain amount of gas to keep the cracks open, called "base gas." Base gas volume remains steady around 4.3 trillion cubic feet. The remaining 4.2 trillion cubic feet of storage is for "working gas." That's gas available for use.
The Energy Information Administration publishes how much working gas we have in storage. As of October 9, that was 3.7 trillion cubic feet. We only have 0.5 trillion cubic feet of storage left. In other words, we're at 94% capacity. Over the last six weeks, we added about 65 billion cubic feet per week. Unless demand changes quickly, we'll fill up the remaining space by early December.”
So why are prices rising? Well, the number of drilling rigs is running at 726, down from 1600 in September of last year. Also, tight credit is helping to further feed the cutback in production. So, in spite of the supply situation, the current slowdown in production, coupled with a 70% drop in prices may be part of the answer.
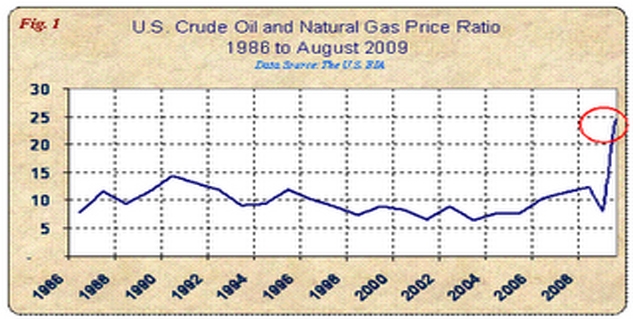
Then there is the haunting Natural Gas to Oil ratio. In theory, based on an energy equivalent basis, crude oil and natural gas prices should have a 6 to 1 ratio. Strangely enough that hit close to 25 to 1, an obvious historical high. Currently it is running at 13.75, still 2x it’s historical.
Could the big inventories be somewhat of an illusion as traders look past the current data? I don’t know, but I would imagine that when we work through these inventories, we could see a sustained move in Natural Gas prices.
If you would like to keep and eye on the storage numbers yourself, Matt gives out some useful information.
“Go to the EIA's website http://www.eia.doe.gov/oil_gas/natural_gas/ngs/ngs.html. Look at the table for Working Gas in Underground Storage. In the lower left corner, you can see the total for the week (3,716 billion cubic feet, as of October 9). Subtract that number from 4,200 billion cubic feet and you can see how much room we have left. You can also scroll down and check out the "Working Gas in Underground Storage" graph. That shows you the trend in red, compared to the historical range in gray.”
Enjoy this article? Like to receive more like it each day? Simply click here and enter your email address in the box below to join them.
Email addresses are only used for mailing articles, and you may unsubscribe any time by clicking the link provided in the footer of each email.
Charles Maley
www.viewpointsofacommoditytrader.com
Charles has been in the financial arena since 1980. Charles is a Partner of Angus Jackson Partners, Inc. where he is currently building a track record trading the concepts that has taken thirty years to learn. He uses multiple trading systems to trade over 65 markets with multiple risk management strategies. More importantly he manages the programs in the “Real World”, adjusting for the surprises of inevitable change and random events. Charles keeps a Blog on the concepts, observations, and intuitions that can help all traders become better traders.
© 2005-2022 http://www.MarketOracle.co.uk - The Market Oracle is a FREE Daily Financial Markets Analysis & Forecasting online publication.