U.S. Dollar Index Elliott Wave Analysis Update
Currencies / US Dollar Oct 27, 2009 - 05:18 AM GMTBy: Alistair_Gilbert
 One of the wonderful things about watching and trading currencies is the frequency with which they comply to Fibonacci retracements. Part of the reason is that the foreign exchange market is the most liquid and the most widely traded on a global basis, so Elliott Wave analysis, which is based on mass crowd psychology, works best.
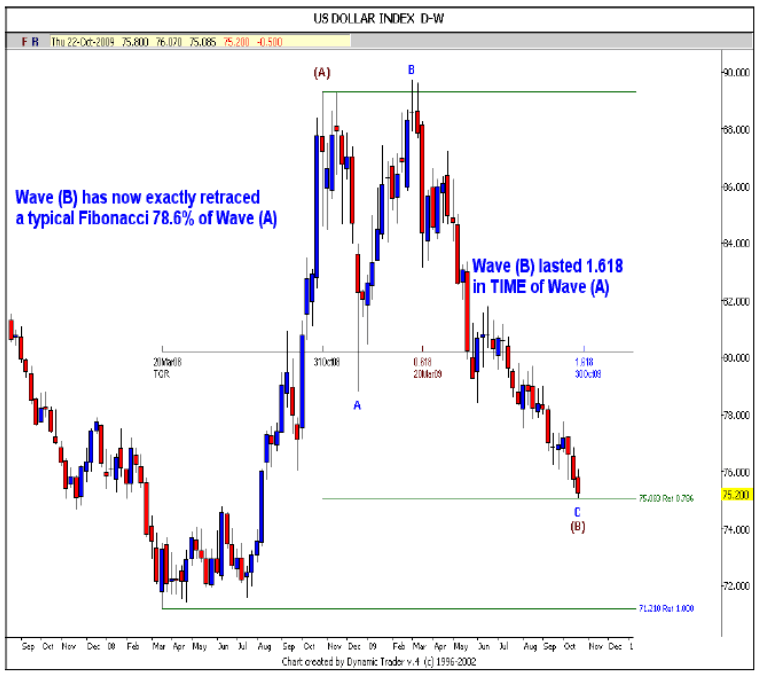
Yesterday the US Dollar Index complied perfectly with another Fibonacci retracement level in this extended wave c of (B) when it stopped exactly at the 78.6% retracement of Wave (A) up.
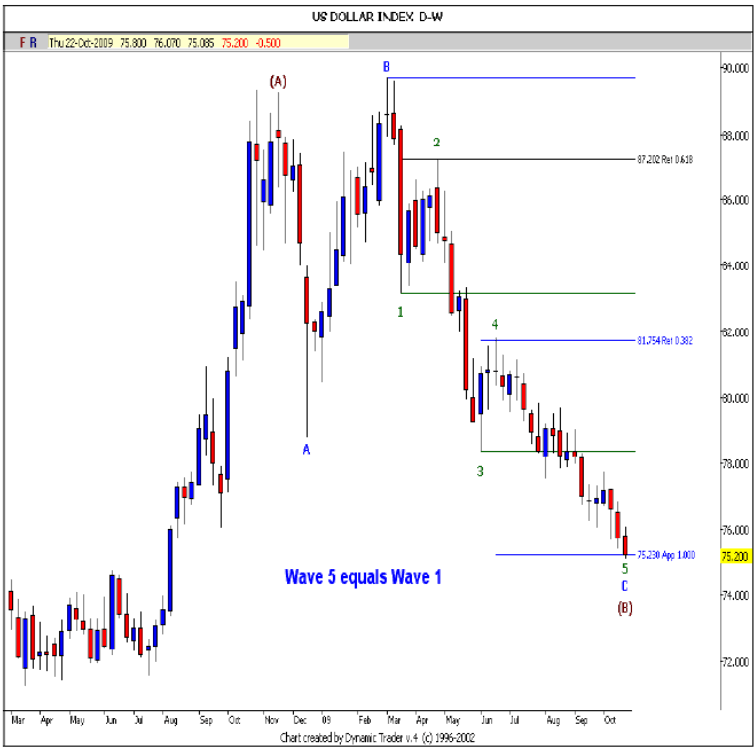
In addition it stopped at the level where Wave 5 is equal to Wave 1 in PRICE.
If the dollar has bottomed, as I believe, then this will be a major turning point for most markets, as if the dollar rises from here, commodities will fall.
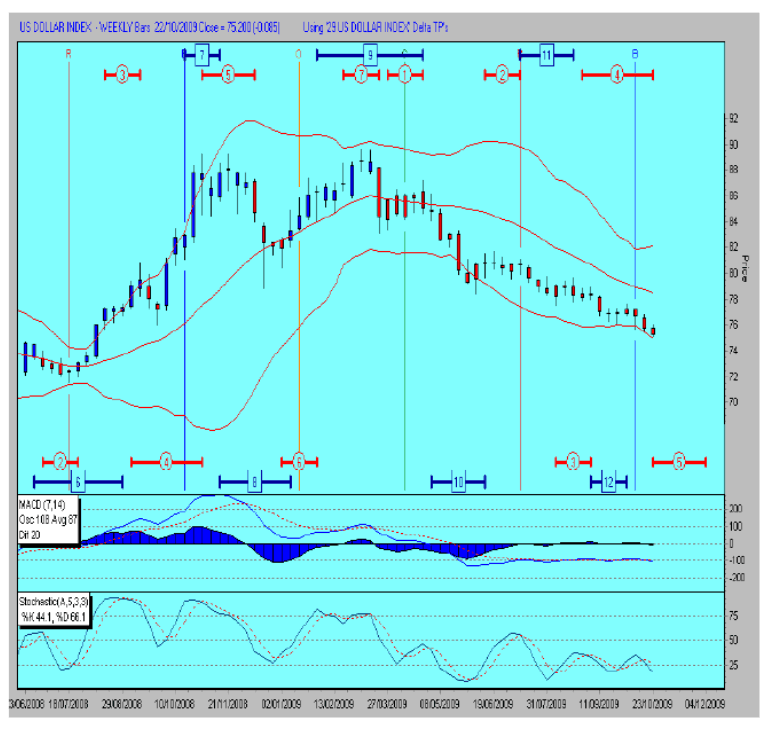
If we look at the Weekly DELTA chart, we can see that LTDs 6,7,8,9, & 10 all arrived on TIME. However, when there is a big move due, the LTD at the beginning arrives early and the LTD and the end arrives late. Thus LTD 11 arrived slightly early with M2 and LTD 12 low has arrived slightly late with M5 low.

Note also how there has been positive divergence on the MACD Histogram in the last couple of months as PRICE has been falling. We should now move up to LTD 13 high due mid January 2010.
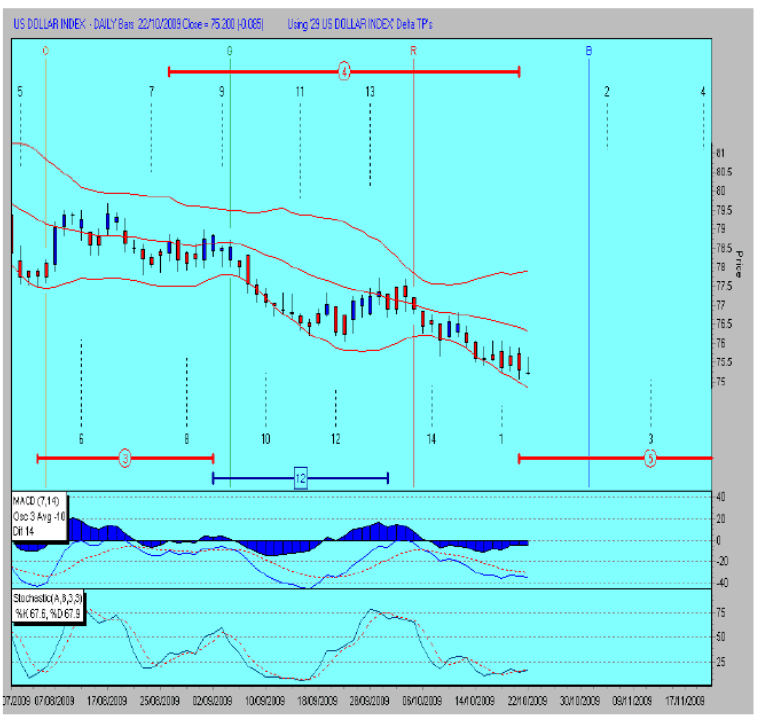
If we move to the Daily DELTA chart, we can see that the US Dollar put in its low on the last day within the second standard deviation of LTD 12 low. Yesterday we had a hammer candlestick, which is often a signal for a change of direction.

Looking at the MACD Histogram, we have had positive divergence for the last week. The 8 period Stochastic has not given a buy signal yet but a move up through 25 would confirm a new trend.
In Elliott Wave terms, if Wave 3 is the extended wave, we expect wave 5 to equal wave 1 in PRICE. On this DT chart you can see that it has complied perfectly.

From this chart you can also see that Wave 2 was a perfect 61.8% retracement of Wave 1 and Wave 4 was a perfect 38.2% retracement of Wave 3.
Further confirmation that this is the end of the dollar’s fall is that the low on Wednesday at 75.085 was also within 2 one thousandths of the Fibonacci 78.5% retracement of Wave (A). Furthermore, Wave (B) has lasted a Fibonacci 1.618 in TIME of Wave (A).

The ideas expressed in this Report are the thoughts of Alistair Gilbert and represent part of the intricate process that he goes through before arriving at a trading decision and as such are like a trading diary. Alistair Gilbert is not an authorised investment adviser and as such none of his statements should be construed as investment advice. The value of investments can go up as well as down and trading is very high risk. Readers are advised to consult with their own investment advisers who may be better qualified to offer a trading strategy based on your own individual circumstances.
By Alistair Gilbert
ALISTAIR GILBERT has worked in the markets for over 30 years. He has worked as an institutional research analyst for a firm of stockbrokers where he got his grounding as a technical analyst. He has also worked as branch manager of a firm of stockbrokers managing private client portfolios and as a fund manager for a leading merchant bank. Alistair was also Managing Director of a Swiss Fund Management group with over $1 billion under management and developed the business extensively in the Middle East.
Alistair has now returned to his native England where he now specialises in TIME and PRICE analysis utilising Elliott Wave, DELTA and a range of technical indicators. I can be contacted via alistair@alistairgilbert.com
Disclaimer: The ideas expressed in this Report are the thoughts of Alistair Gilbert and represent part of the intricate process that he goes through before arriving at a trading decision and as such are like a trading diary. Alistair Gilbert is not an authorised investment adviser and as such none of his statements should be construed as investment advice. The value of investments can go up as well as down and trading is very high risk. Readers are advised to consult with their own investment advisers who may be better qualified to offer a trading strategy based on your own individual circumstances.
Alistair Gilbert Archive |
© 2005-2022 http://www.MarketOracle.co.uk - The Market Oracle is a FREE Daily Financial Markets Analysis & Forecasting online publication.


