


Stock Market Trending Towards Mid November Cycle Low
Stock-Markets / Cycles Analysis Nov 08, 2009 - 07:35 PM GMTBy: Andre_Gratian

 Current Position of the Market
SPX: Long-term trend - Down! The very-long-term cycles have taken over and if they make their lows when expected, the bear market which started in October 2007 should continue until 2014. This would imply that much lower prices lie ahead. This will not be a straight-down decline, but will consist of a series of intermediate-term rallies and declines until we have reached the low point.
SPX: Intermediate trend - Signals for an intermediate top continue to be elusive. The top of 1100, as expected, was only that of a short-term trend which may already have bottomed. The rally from the 1030 low is only a temporary move which is near its end and should be followed by a test of the low, at a minimum.
Analysis of the short-term trend is done on a daily basis with the help of hourly charts. It is an important adjunct to the analysis of daily and weekly charts which determines the course of longer market trends.
Daily market analysis of the short term trend is reserved for subscribers. If you would like to sign up for a FREE 4-week trial period of daily comments, please let me know at ajg@cybertrails.com .
Overview:
After stopping just short of our 1109 target, a short-term decline started which hit the 1030 projection square on before it reversed. We are now approaching the end of phase 2 (or wave B) of that decline before resuming the downtrend and completing it near 1010. That is one possibility. The other is that the correction ended at 1030 and, after topping, we'll come back to test that low before continuing the uptrend, possibly to a new high.
By the time we reached 1030, the A/D was more oversold than at any time since the March lows, and my preferred sentiment indicator was getting longer-term bullish. It is even more bullish today,after a rally of 40 points. Nevertheless, the 30/90-day cycles are due to bottom on 11/13, and should bring prices back down temporarily.
Since Monday 11/9 is the next turn date for the Bradley indicator, we could see another short-term reversal to the downside on that date. Hourly momentum oscillators are overbought and ready to reverse, and Friday we reached our near term projection of 1070. The A/D index has lost its deeply oversold status and has returned to neutral. This is as good a price/time target as any to finish the "B" wave and start the "C", or to re-test the low.
As I have pointed out repeatedly, the SPX rally from 667 on March 6 is looking for a top and struggling more and more to keep going. But there is still enough inner strength -- as evidenced by the sentiment bullishness and the inability of an oversold A/D indicator to bring the index down more than it has -- but the next high may be the top, as more and more indexes are lagging. The DJIA is the strongest, masking the growing weakness in the rest of the market, and it has an influence on the SPX.
The NDX is also still strong relatively to the others, and the QQQQ which is currently at 42.59 may want to fill a Point & Figure target of 46 before reversing.
Other evidence that an important top is coming is that the dollar index may have found an important bottom, or is near one and, since the index has traded inversely to the equity indexes for quite a while, reverting to an uptrend should coincide with an intermediate top in the others.
What's ahead?
Chart Pattern and Momentum
On the Weekly Chart, the MSO has finally begun to turn down convincingly, while the MACD has flattened out and is ready to cross lines. Note, however, that instead of making a new low, the price index has reversed sharply to the upside after staying above its 1020 "sell" level. Only when that level is broken convincingly will the longer decline begin.
The Daily Chart of the SPX (below) only has one indicator, but it has been very accurate at calling the reversals. At the last top -- which was a Bradley date -- the indicator showed more negative divergence than at anytime since June. That was quickly followed by a sell signal. The decline drove the indicator to its lowest reading since the March low and, after it sported some minor positive divergence, generated an oversold rally which has brought the indicator back to neutral without giving a confirmed buy signal.
Meanwhile, the index has re-bounded to back-test the lower wedge trend line which it broke in late October, and where it should find resistance. Since we are expecting the decline to resume in some form into mid-November, and since Monday is another Bradley date, we have good reasons -- considering the condition of the hourly indicators -- to expect the decline to resume in this time frame.
The Hourly Chart (above) shows how positive divergence developed in the indicators at the 11/02 low. It was followed by the index breaking the steeper, black down-channel and, after some additional consolidation, moving through the wider brown channel. This has put it in an uptrend which reached a projection to the 1070 level on Friday.
The uptrend is well-defined by a channel and a sell signal will be given when prices move out of it on the downside. The momentum indicators are overbought and could roll-over at any time.
As stated earlier, there are good reasons to expect a reversal as early as Monday which is a Bradley date.
Cycles
The cycle which matters the most right now, is the 3m/9m cycle. This cycle is expected to make its low ideally on November 13. Some analysts are calling for a low as late as 11/23. We'll let the market set the date.
Projections:
From 1020, we had a potential target of 1109 for the rally top, and the high was 1101.36. We then had a projection of 1030 for the subsequent low. It came in at 1029.38. On Friday, the SPX slightly surpassed our 1069/70 target early in the day by printing 1071.48, trading sideways for the rest of the day, and closing at 1069.16.
If it does not want to stop there and decides to move higher, an extension of the move could take it to 1077.
We cannot project any price for the 9-mo cycle low until a top has been made.
Breadth
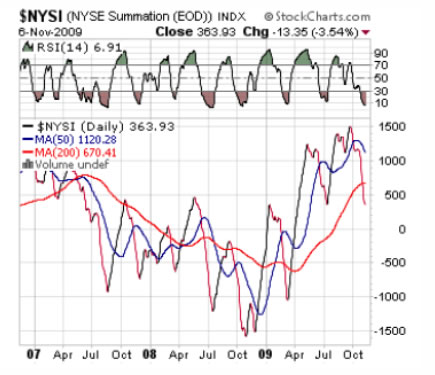
The NYSE Summation index (courtesy of StockCharts) has continued to weaken significantly and has now moved through its 200-DMA. Since it is now at the level of its July low, this has to be considered long-term negative divergence to the SPX which was considerably lower at that time. However, note that the RSI is very oversold, which could point to an imminent low in the index, and in the equity indices.
The indicator on the daily SPX chart, above, is also made up of A/D data. It, too, became very oversold recently, but has begun to rally. Since it could be considered a shorter-term version of the NYSI, it may be signaling a turn in this intermediate indicator with the expected consequences for the equity indices.
Market Leaders and Sentiment
This is what I wrote in the last newsletter, two weeks ago: The sentiment indicator (courtesy of Sentimentrader) is one reason that I cannot get too bearish, just now. It seems to signal an imminent short-term low and not much of a readiness for an intermediate high.
I have purposely included the indicator which was in the last newsletter so that the more recent one can be compared to it. What do we see? That the long-term reading is more bullish today than it was two weeks ago. How can we reconcile this reading with a market which is expected to crash at anytime in a bearish wave 3 of 3? Either the indicator is giving a false reading, or the analysis is wrong.
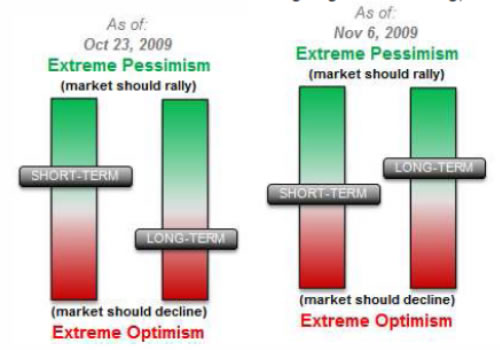
My conclusion is that we will have to wait for this indicator to give a far more bearish reading before we are ready to have a severe decline. Not only that, but if the market -- as expected -- declines even more into the 90-day cycle low, it should increase the bullishness of the index. Meaning that there is a very good chance that a strong rally will take place after the cycle makes its low which could easily drive prices to new intermediate highs.
Summary
If the 90-day cycle makes its low as scheduled in mid-November, it may only cause a retracement which will be a test of the 1030 low.
The short-term indicators are overbought after a 40-point bounce from the 1030 low, but the longer-term ones are getting bullish.
The following are examples of unsolicited subscriber comments:
Awesome calls on the market lately. Thank you. D M
Your daily updates have taken my trading to the next level. D
… your service has been invaluable! It's like having a good technical analyst helping me in my trading. SH
I appreciate your spot on work more than you know! M
But don't take their word for it! Find out for yourself with a FREE 4-week trial. Send an email to ajg@cybertrails.com .
By Andre Gratian
MarketTurningPoints.com
A market advisory service should be evaluated on the basis of its forecasting accuracy and cost. At $25.00 per month, this service is probably the best all-around value. Two areas of analysis that are unmatched anywhere else -- cycles (from 2.5-wk to 18-years and longer) and accurate, coordinated Point & Figure and Fibonacci projections -- are combined with other methodologies to bring you weekly reports and frequent daily updates.
“By the Law of Periodical Repetition, everything which has happened once must happen again, and again, and again -- and not capriciously, but at regular periods, and each thing in its own period, not another’s, and each obeying its own law … The same Nature which delights in periodical repetition in the sky is the Nature which orders the affairs of the earth. Let us not underrate the value of that hint.” -- Mark Twain
You may also want to visit the Market Turning Points website to familiarize yourself with my philosophy and strategy.www.marketurningpoints.com
Disclaimer - The above comments about the financial markets are based purely on what I consider to be sound technical analysis principles uncompromised by fundamental considerations. They represent my own opinion and are not meant to be construed as trading or investment advice, but are offered as an analytical point of view which might be of interest to those who follow stock market cycles and technical analysis.
Andre Gratian Archive |
© 2005-2022 http://www.MarketOracle.co.uk - The Market Oracle is a FREE Daily Financial Markets Analysis & Forecasting online publication.