Stock Market Investors Needn’t Fear a Double-Dip Economic Recession
Stock-Markets / Financial Markets 2009 Nov 09, 2009 - 05:56 AM GMTBy: Money_Morning
 Jon D. Markman writes: A new report contains some very good news for investors: Double-dip recessions are very rare.
That means that a drop back into recessionary conditions looks less and less likely even as unemployment creeps higher and has crossed the 10% threshold for the first time in a quarter century.
After reviewing U.S. economic history all the way back to the 1850s, Deutsche Bank AG (NYSE: DB) economists found that double-dip recessions are exceedingly rare: There have only been three episodes in which the economy has fallen back into recession within a year of a previous recession ending. And that’s out of 33 recessions that have taken place since 1854.
Indeed, when these double-dip downturns do occur, they happen under circumstances quite different from today’s situation.
Two of the three double-dips happened in the years prior to World War II – in 1913, and again in 1920. The more relevant example was the double-dip recession of the early 1980s, which was driven by the fight against double-digit inflation rates.
U.S. President Jimmy Carter imposed credit controls in March 1980, which resulted in a sharp but short-lived recession before the economy expanded again for 12 months. Then U.S. Federal Reserve Chairman Paul A. Volker hiked short-term interest rates to 20% in the summer of 1981, as he pushed the economy back into recession but dealt a death blow to inflation.
With deflation just as likely as inflation at the moment, a repeat of the 1980s just isn’t in the cards, as the Fed is set to keep rates at very low levels until the end of 2010.

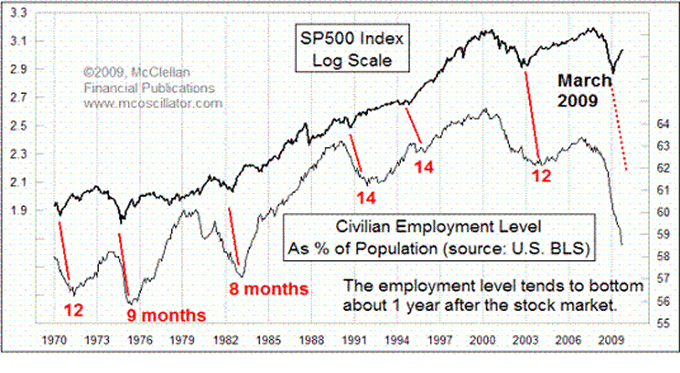
Tom McClellan of the McClellan Market Report has some more potentially good news. As you can see in the chart above, the level of employment tends to follow stocks on a 12-month lag. It’s not a perfect match: The red numbers show the actual lags of important turning points over the last forty years. But the correlation is strong enough to provide one more piece of evidence that the “turn” in employment is perhaps four months or so in the future.
So while the public will continue to be preoccupied by a still rising unemployment rate and political chatter over the perceived failure of the Obama administration’s stimulus package – the market will continue to anticipate the improvement just over the horizon.
One final note: The economists at ISI Group note that outside of the United States, employment already started to grow in 11 economies. These include Japan, Canada, Singapore, Brazil, Russia, Sweden, and Taiwan. Stocks have sniffed out the fact that a global employment turn is already happening. The U.S. economy just isn’t fully participating yet, but it will.
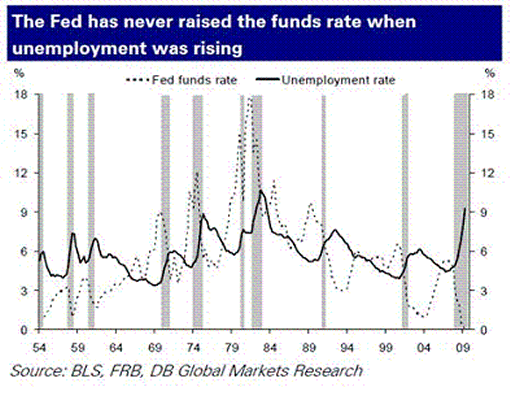
Financial television was all atwitter last week during the Fed’s policymaking Federal Open Market Committee (FOMC) meeting, wondering if central bank governors would raise rates. They shouldn’t have wasted their breath. The Fed is very unlikely to raise rates next year – and if it does, it won’t be until the 2010 fourth quarter. History shows the Federal Reserve has never increased interest rates while unemployment was still rising. In fact, the Fed has waited at least six months after the peak in unemployment and when the unemployment rate has dropped by 0.7% from its high before hiking rates according to the Deutsche Bank report. Moreover, during periods of low to no inflation – like we have now – the Fed can wait twice as long before raising rates.

Given their forecast for unemployment – peaking this quarter before falling back to 9% in the latter part of 2010 – Deutsche Bank economists expect the first tightening of 0.25% to occur at the Fed’s August 2010 meeting. They see another 0.25% hike the ensuing September meeting to be followed by a 0.5% hike at the November meeting. After that, the team expects 0.5% hikes during alternating meetings. This would bring short-term interest rates to 1.25% next year and 3.25% in 2011.
Yet an ultra-low interest rate is not the only policy tool the Fed is using. Various rescue programs, along with unconventional “quantitative easing” strategies that saw the Fed make direct purchases of U.S. Treasury Department debt and mortgage securities, has more than doubled the Fed’s balance sheet to more than $2 trillion. Some believe that the Fed will start to sell off its assets, thereby pushing up long-term interest rates, before it raises its short-term policy rate. This would raise both mortgage rates as well as the government’s cost of borrowing.
Given the worries over the federal deficit as well as the fragile state of the housing market, I don’t think this is likely. Instead, I expect the Fed will increase the interest rate it pays to banks that park extra cash in its vaults instead of lending it out. This helps suck extra dollars out of the system while not disrupting the bond market with an influx of supply.
Starting late next year, look for the Fed to possibly raise its policy rate as well as the interest rate it pays to banks. Mortgage rates and other long-term interest rates should start creeping higher next spring as the Federal Reserve ends its direct purchase program. But a large spike in rates will likely be avoided as the Fed slowly sells the debt it’s already purchased. The Fed will try to avoid being seen as the heavy for any dislocation that might follow at all costs.
Stocks are poised to recover and to pounce toward new highs. They are oversold, the Fed is holding the line, and earnings growth is on track. The past week’s performance was anemic, but bulls still have control of the wheel.
How to play this: Just to keep it simple, continue to hold Vanguard Total World Stock Market Exchange Traded Fund (NYSE: VTI) to participate.
The ETF is currently trading at $42.21. The target price is $45. Set a sell stop at $39.49 in case of trouble.
The Week in Review
Stocks shrugged off a tough jobs report on Friday to post gains for the fifth straight day: The Dow Jones Industrial Averagegained 0.2%, the Standard & Poor’s 500 Indexgained 0.3%, and the Nasdaq Composite Indexgained 0.3%. The Russell 2000 was the exception, falling 0.1%.
Industrial/finance/media giant General Electric Co. (NYSE: GE) was the day’s highlight, rising 6.2% on a pair of analyst upgrades. This helped push the Industrial SPDR (NYSE: XLI) up 0.9%. Other top performers included materials stocks, up 0.9%, as well as consumer discretionary stocks, up 0.9%. Financial stocks lagged as sellers focused on embattled insurer American International Group Inc. (NYSE: AIG) after it reported better-than-expected quarterly results. AIG sank 9.7% while the Financials SPDR (NYSE: XLF) dropped 0.4%.
The U.S. dollar was largely unchanged. Crude oil lost 2.8% as it flirts with the $80 level. Gold added 0.5% as it moved to yet another new high of $1,101.40.
Total volume fell 16.8% as just 1.08 billion shares traded on the New York Stock Exchange (NYSE:NYX). It was the lightest session since the rally peaked in mid-October, but was that significant?
Well, much of the loss of trading was probably attributable to traders’ distraction during the parade in Manhattan to celebrate the World Series victory of the New York Yankees. But that doesn’t explain the whole story.
Recent rallies out of oversold conditions in July, August, and October were accompanied by a much greater expansion of volume than the recent rally even when you don’t count Friday, so the light volume in the past week is a black mark against the bulls. Breadth has also been lackluster as the percentage of stocks above their 10-day moving average has stalled near 66%.

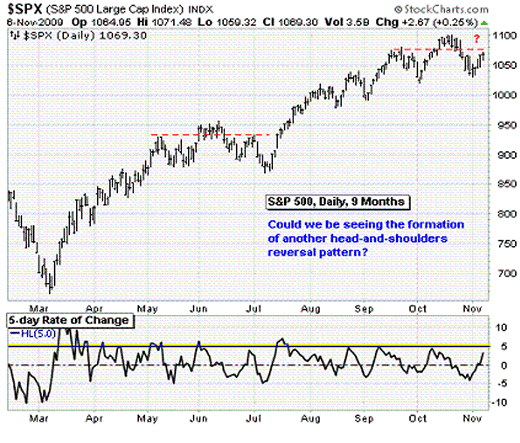
Buying intensity has also failed to live up to the precedent set by previous rebounds. Since the March low, the first five days of a rebound rally have typically returned more than 5%, which shows up in a five-day Rate of Change chart like the one above. While the S&P 500 was able to snap a two-week losing streak, it has only gained 3.2% over the past five days. The only other sub-5% five-day rebound was during the brief bounce the end of June before the market dropped into the July low.
What this means is that U.S. stocks have put in a pretty meager rebound after the 90% downside day last Friday. These rallies typically last five to seven days before they fall apart. To receive a clear indication that stocks put in a durable bottom out Oct. 30, from which an intermediate-term rally can develop, we need to see a stronger rise in volume and an expansion in breadth.
I’m not saying it can’t happen. I’m just saying that clock is ticking. If the bulls don’t show decisive strength, then the bears will interpret that as a sign of weakness and jump back into the fray with claws and fangs flashing. Heading into the new week, we’re in “show me” mode, particularly for the badly deteriorating Nasdaq 100 stocks not named Google Inc. (Nasdaq: GOOG), Microsoft Corp. (Nasdaq: MSFT), Amazon.com Inc. (Nasdaq: AMZN) or Apple Inc. (Nasdaq: AAPL). Stay alert.
To close on an optimistic note, remember that history, economic fundamentals, corporate profits, and easy monetary policy all suggest that stocks should ultimately vault to higher highs.
It may take another harrowing drop to really engage the buyers, but I’m still projecting a rally through the end of the year. Watch the 1,070 level of the S&P 500 as your guidepost. If the bulls can get over that level and hold it for a week, bears will likely stand aside and give them a free past at least to 1,100, and possibly all the way to 1,200. If bulls are not able to surmount 1,070 in the next week or two, then we may be in for six months to nine months of pushing and shoving in a range between 985 to 1,070 that satisfied neither side but ultimately proves to be a springboard late next year.
Monday: The ISM Manufacturing Index rose farther into expansion territory in October with a reading of 55.7. This was well above the consensus estimate of 53 and September’s 52.6 result. Any reading above 50 indicates expansion. Much of the gain was due to some much needed improvement in the employment sub-index: The measure increased nearly seven points to 53.1 as manufacturers added to payrolls during the month.
I’ve been closely watching the rise in the new order gauge over the past few months, waiting for manufacturers to respond with new hiring and expanded inventories as production ramps. Managers waited until the last second, but they had no choice – the economic recovery has forced them to replace their recession mindset with a more constructive outlook.
Tuesday: Consumer demand for new cars continues to recover even after the expiration of the government’s rebate program: Domestic auto sales jumped nearly 20% in October to an annual rate of 7.9 million vehicles. This was well ahead of the consensus estimate of 7.3 million vehicles.
Wednesday: The Federal Reserve ended its two-day policy meeting. As expected, interest rates were left unchanged since economic conditions “warrant exceptionally low levels of the federal funds rate for an extended period.” But policymakers did note recent stabilization in the housing sector and an uptick in consumer spending.
The only meaningful change was a $25 billion reduction, to $175 billion, in the amount of mortgage debt the Fed will purchase. While the Federal Open Market Committee members said the reduction was done to reflect “the limited availability” of the debt, my hunch is that they wanted to test the market’s reaction to a modest withdrawal of support as they plan their exit strategy.
Thursday: Initial jobless claims continue to decline and registered its smallest loss since January. The four-week average dropped for its ninth straight week to 523,750. This is down by 25,000 since September.
Friday: Consumers are rapidly reducing their debt burdens. The Federal Reserve reported that consumer credit fell by a larger than expected $14.8 billion in September. The bulk of the decline, some $9.9 billion, was due to credit cards and other revolving credit.
In conclusion, stocks are poised to recover and pounce toward new highs. They are oversold, the Fed is hold, and earnings growth is on track. The past week’s performance was anemic, but bulls still have control of the wheel. Just to keep it simple, continue to hold Vanguard Total World (NYSE: VTI) to participate. It’s at $42.21 currently. Target $45. Set a sell stop at $39.49 in case of trouble.
The Week Ahead
Monday: No major economic releases.
Tuesday: A number of Federal Reserve officials will speak, including the San Francisco Fed President Janet Yellen. She will be talking about the economic outlook and real estate in Arizona.
Wednesday: The Veterans Day holiday will be celebrated, but stock and futures markets will remain open. Retailer Macy’s Inc. (NYSE: M) will report earnings.
Thursday: Weekly initial jobless claims will be reported. Retailer Nordstrom Inc. (NYSE: JWN) and entertainment giant The Walt Disney Co. (NYSE: DIS) will report earnings.
Friday: An update on the trade balance and consumer sentiment. J.C. Penney Co. (NYSE: JCP) will report earnings.
[Editor's Note: New Money Morning contributor Jon Markman is a veteran portfolio manager, commentator and author. He is currently the editor of two investment-research services, Strategic Advantage and Trader's Advantage. For information on obtaining a two-week free trial to the daily commentary of the Strategic Advantage, please click here.
Markman is also an accomplished author and, as mentioned in this story, has his fourth book about to debut. That book is an annotated edition of the 1923 book, "Reminiscences of a Stock Operator" an investment classic that most experts rate as one of the top business books of all time. For more information on the book, which is due to debut in early January, please click here.]
Money Morning/The Money Map Report
©2009 Monument Street Publishing. All Rights Reserved. Protected by copyright laws of the United States and international treaties. Any reproduction, copying, or redistribution (electronic or otherwise, including on the world wide web), of content from this website, in whole or in part, is strictly prohibited without the express written permission of Monument Street Publishing. 105 West Monument Street, Baltimore MD 21201, Email: customerservice@moneymorning.com
Disclaimer: Nothing published by Money Morning should be considered personalized investment advice. Although our employees may answer your general customer service questions, they are not licensed under securities laws to address your particular investment situation. No communication by our employees to you should be deemed as personalized investment advice. We expressly forbid our writers from having a financial interest in any security recommended to our readers. All of our employees and agents must wait 24 hours after on-line publication, or 72 hours after the mailing of printed-only publication prior to following an initial recommendation. Any investments recommended by Money Morning should be made only after consulting with your investment advisor and only after reviewing the prospectus or financial statements of the company.
Money Morning Archive |
© 2005-2022 http://www.MarketOracle.co.uk - The Market Oracle is a FREE Daily Financial Markets Analysis & Forecasting online publication.


