Crude Oil in Bullish Pattern, though Comparison to U.S. Dollar Warrants Caution
Commodities / Crude Oil Nov 09, 2009 - 11:20 AM GMTBy: Mike_Paulenoff
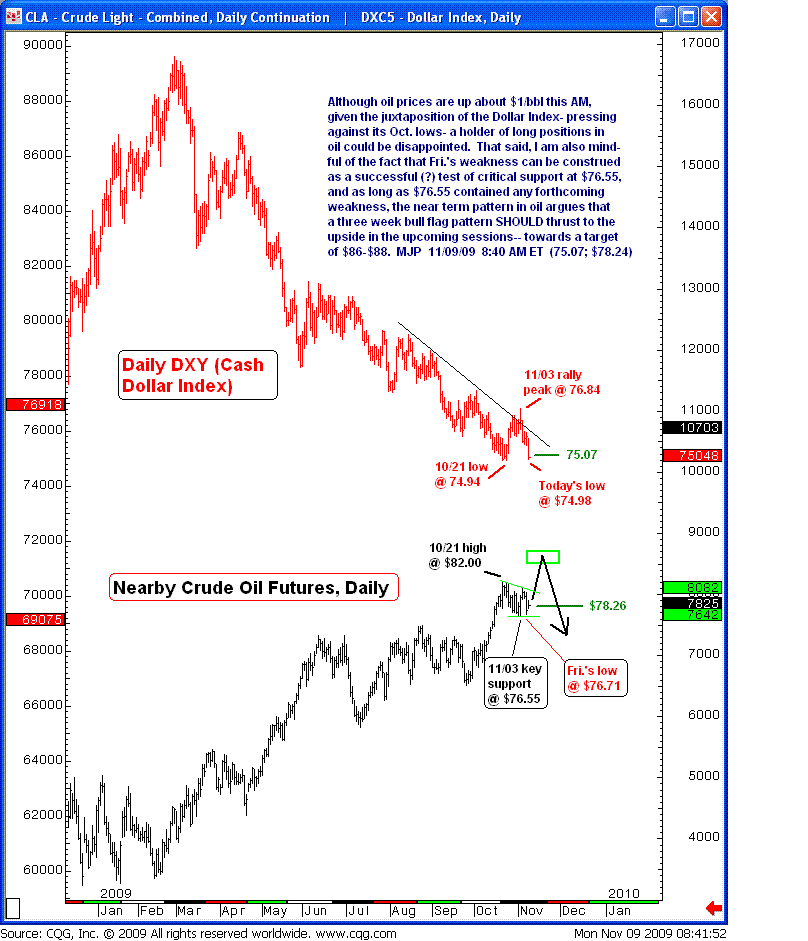
Although oil prices are up about $1/bbl this morning, given the juxtaposition of the dollar index pressing against its October low (see our comparison chart of oil and the dollar), a holder of long positions in oil and the US Oil Fund ETF (NYSE: USO) could be disappointed.
That said, I am also mindful of the fact that Friday's weakness can be construed as a successful test of critical support at $76.55, and as long as $76.55 contains any forthcoming weakness, the near-term pattern in oil argues that a three-week bull flag should thrust to the upside in the upcoming sessions – towards a target of $86-$88.

Sign up for a free 15-day trial to Mike's ETF Trading Diary today.
By Mike Paulenoff
Mike Paulenoff is author of the MPTrader.com (www.mptrader.com) , a real-time diary of Mike Paulenoff's trading ideas and technical chart analysis of
Exchange Traded Funds (ETFs) that track equity indices, metals, energy commodities, currencies, Treasuries, and other markets. It is for traders with a 3-30 day time horizon, who use the service for guidance on both specific trades as well as general market direction
© 2002-2009 MPTrader.com, an AdviceTrade publication. All rights reserved. Any publication, distribution, retransmission or reproduction of information or data contained on this Web site without written consent from MPTrader is prohibited. See our disclaimer.
Mike Paulenoff Archive |
© 2005-2022 http://www.MarketOracle.co.uk - The Market Oracle is a FREE Daily Financial Markets Analysis & Forecasting online publication.


