


Testing Time for the USD and Aging Stock Market Rally
Stock-Markets / Financial Markets 2009 Nov 11, 2009 - 06:31 AM GMTBy: Garry_Abeshouse

 No one alive has probably experienced a time when so much highly geared money has been controlled by so few large corporations, who with their accumulated power, have governments all over the world running scared. This power has been magnified with the continued availability of government handouts and cheap funding from the USD Carry Trade. This has created an "Open Sesame" to a monetary wish list that has no limits for those involved. It makes for a deceptive market, with a bought out and manipulative mainstream media, who constantly refuse to provide cogent introspection and analysis of the high risk and highly geared trading activities of the major banks. Don’t forget that Goldman Sachs has a debt to capital ratio of over 1000:1.
We are now over eight months into a bear market rally, the worlds debt levels have changed little and the major banks' derivative Ponzi schemes are as large as ever and now I am being lead to believe by these people, that the worst of the current financial nightmare is behind us. If only it was so easy. Unfortunately Hyman Minsky was right about the inherent instability of markets and how they are controlled, not so much by economics but by human behaviour and frailties. It is these that have provided the catalyst for every bear market and Ponzi scheme in history and I sincerely doubt that the future will be any different.
With that in mind, we should be prepared for a series of financial brawls for survival between the corporate Banksters on one hand and world governments on the other. While we as always will be the meat in this rather volatile sandwich, merely collateral damage to the greed of a privileged few.
This situation, where the USD "Carry Trade" is financing the trading activity of the largest banks cannot go on forever, the inherent instability of the financial markets will see to that. So when a change does occur (and there will be many incremental adjustments over time), and given the delicate balance of the financial markets at the moment, any small switch in emphasis of this trading mix will have a greatly magnified affect on prices.
And with equities at non sustainable highs, the most likely scenario is still the one I have discussed over the last few weeks, one which continues to justify the significance of the huge downward wedge in the USD. It still looks like the USD, the British Pound and the US treasuries will be the confirming indicators of the next move, with the distinct possibly that USD short covering could create more drama and fireworks than there would normally be.
All financial markets are showing signs of confusion and strain, with short term whipsaw moves common. So this is the time to step back to look at the big picture, as there is no other way to position the markets into their most appropriate time and place. Well thought out long term charts allow you do this, assisting our positioning of now, within the historical context. Without this knowledge the compass does not know where to point and you are flying blind.
Unaccustomed as I am to writing mid week market commentary, I put my heart in my mouth and hope it is not immediately followed by both feet. So here goes.
Overview
The overall assumption I make in the following comments is that the tooing and frowing of the eight month rally in equities, still a major driving force behind most of the markets, is showing signs of both age and confusion. I do not think this situation can last very much longer, as many of the US financial indexes are showing poor relative strength verses the major composites and have broken nearby support levels already – unlike the major indexes. Even a relatively small fall will break through important key support levels, not apparent in the major composites, causing the greater part of the market to progressively unravel over time. That's the less bearish prognosis.
An alternative scenario is that one or more of the hedge fund or bankster traders will stuff up big time on one or more of their multi-trillion dollar off balance sheet trades and the proverbial s--- will hit the fan.
Not a pretty sight and not something that can be predicted with any surety - but certainly a probability none the less and there are plenty of precedents to compare with.
US Dow 30 Industrials Index
A continuation of the short term move up to 10320 (if it gets there) would hit a well defined resistance line on my Comex 20pt intraday chart for the 5th time, form where I expect there to be a significant downward reaction. Significant low points on this chart to be aware of on the way down would be 9600, 9360, 9200 and lastly 9000 - an important psychological level.
US S&P 500 Large Cap Index
A continuation of this move up could see this index (Comex) somewhere between 1100 and 1300 before a reaction will set in. On the way down, initial support lies between 980 and 1020, then its down to 874. A move down through 874 would certainly confirm the end of the rally and would dramatically increase the likelihood of a testing of the March 2009 lows.
US Nasdaq 100 Index
My 4pt Comex chart bounced off the 8 month uptrend at 1660 and is now testing the highs at 1776. No negatives yet - except perhaps for an unnoticed divergence. For the first time in 8 months, there is now a significant divergence between the Nasdaq 100 Index (NDX) and the Philadelphia Semiconductor Index (SOX), with the SOX Index now lagging well behind the Nasdaq 100 Index. I see this divergence, if it continues, to be a bearish rather than a bullish sign of future moves in the equity markets.
USD Index
Downward sloping wedges cannot go on forever and as we are now at the bottom of this formation, the longer it takes to resolve on the upside, the more likely there will be a bear trap, at least one more sharp move down to at least 74 and perhaps even to about 72.6. The levelling out of prices above 75 at the bottom of this wedge until today’s wekness, together with some early excitement moves, is highlighting that some traders may be getting a little too excited a little too early.
Short term though, the 75 support level in the USD Index is being tested and at the time of writing has moved down to 74.9. If the 75 support is decisively broken (as against a short whipsaw bear trap move down to 74 or below), then all bets are off. Short term moves in the Euro above 1.50 highlight the inverse scenario to the USD, which is expected.
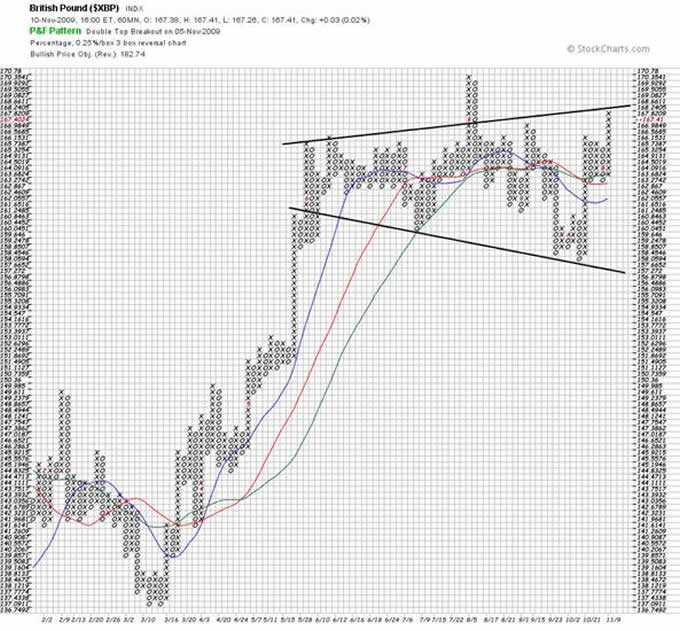
British Pound/USD
The consolidation area formed by the British Pound since June, has taken on the appearance of a broadening formation top and like the equities, is currently testing its local highs. As I write these words, my new 0.02pt Comex chart has shown immediate term weakness by failing to test the recent 1.684 high, then breaking a short term up trend by falling to 1.664. I still feel this currency will be one of the most important players of the next major move in the financial markets. Watch for a potential bull trap, as with other currency pairs against the USD.
AUD/USD
For the Aussie Dollar, it is now time to stand up and be counted. At 0.929 it is currently testing the October 2009 high and has moved up through November in a very tight trend channel on my 0.001 intraday Comex chart. Like nearly all the currencies, the AUD has moved up against the USD since early March, along with the equity markets, Copper and rising interest rates. The AUD is a follower not a leader, so short term moves are contingent upon what happens elsewhere. Obviously a move through 0.930 will see the pair move into new territory, with the next target about 0.950, a psychological point as well. On the downside, a break below 0.923 would see local support and the previously mentioned short term downtrend penetrated. I would then consider any move continuing below 0.914 to be moderately bearish, while a fall below the November 2nd low of 0.889 would also break a well defined 4 month uptrend. A break below 0.840 would be getting into a longer term bearish category.
Yen/USD
The Comex 0.002 pt chart shows 2 uptrends. The shorter one since August 7th was broken on October 15th and has been working under this line ever since. It could pullback further to this line at 1.130. The October high was 1.136. Recent lows are at 1.082 while for the near term this uptrend will be around 1.070. A break below 1.070 would be significant. Again a follower not a leader. The key issue here though will it follow the USD or the Euro. At the moment it has the potential to do either – unlike the Euro, which is the inverse of the USD.
US Treasuries
They still appear to be basing out in preparation for a rise, but like everything else, have not given any confirming signals of the next move.
10 year T-Notes - A move above 120 would be good for the bulls, while a break below 116.5 would at least temporarily negate the bullish scenario here.
30 yr T-Bonds - My new sensitive 0.2pt Comex intraday chart is basing quite nicely as long as it stays at or above 117.8 – whipsaw bear traps excepted.
Gold at 1118, on my 5pt intraday Comex chart has hit the top resistance line of a broad secondary trend channel, with the last point of contact being the nudge through 1000 in mid February 2009. The current price also coincides with the convergence of 2 other trend lines, which more often than not tends to strengthen the case that the current run up to 1118 will come to at least a temporary halt, so is more likely to have a reaction down from here rather than go up further - at least in the short term. The main uptrend parallel to this trend line goes back to October/November 2008.
Copper
Bullish traders are still active in Comex and with the October/November uptrend still intact, I can see preparations for another attack of the highs above 3.0, but expect resistance above 2.98 to be heavy and constant. A fall below 2.90 would confirm new local lows and break this uptrend as well and probably coincide with moves down in other markets as well.
Oil
The high in the Comex oil price on October 21st 2009 of 82, reconfirmed the main resistance line of a 12 month upward wedge pattern in spot oil on my 0.5pt intraday chart, with the shorter term uptrend sitting at about 72 to 73. It is probable that oil and oil stocks may be good early indicators of the downturn in equities.
Till next time.
Garry Abeshouse
Technical Analyst.
Sydney
Australia
I have been practicing Technical Analysis since 1969, learning the hard way during the Australian Mining Boom. I was Head Chartist with Bain & Co, (now Deutsch Bank)in the mid 1970's and am now working freelance. I am currently writing a series of articles for the international "Your Trading Edge" magazine entitled "Market Cycles and Technical Analysis".
I have always specialised in medium to long term market strategies and after discovering the excellent Point & Figure Charts from Stockcharts.com in mid 2008, have concentrated on this style of charting ever since.
© Copyright Garry Abeshouse 2009
Disclaimer: The above is a matter of opinion provided for general information purposes only and is not intended as investment advice. Information and analysis above are derived from sources and utilising methods believed to be reliable, but we cannot accept responsibility for any losses you may incur as a result of this analysis. Individuals should consult with their personal financial advisors.
© 2005-2022 http://www.MarketOracle.co.uk - The Market Oracle is a FREE Daily Financial Markets Analysis & Forecasting online publication.