


Gold Price 2010 Forecast $1,500 and Seasonal Influences on Precious Metals
Commodities / Gold & Silver 2009 Nov 13, 2009 - 03:35 PM GMTBy: Madison_Avenue_R

 Madison Avenue Research Group's outlook for gold and silver is bullish. Our sentiments echo John Licata, Chief Investment Strategist at the energy and metals independent research and advisory service Blue Phoenix. Last year Licata wrote a note to his clients telling them gold was going to hit $1200 this year - a bold prediction at the time yet stunningly accurate in retrospect. On BNN this week Licata said he is still in the process of formulating targets for 2010 but did say he "could see gold going North of $1,500 next year”.
Licata cited the recent move in gold on a myriad of factors including :
- Statements that came out of the G20 last weekend supporting continued stimulus; Licata said “If we keep getting more stimulus, that conversation could go from ‘deflation’ to ‘hyper inflation’ maybe towards the end of 2010 even 2011.”
- Lack of support for US dollar; there is an “absence of US Treasury Secretary backing support for the US dollar” … “the administration has been so laissez faire”.
- Increased unemployment, now at 10.3% in the USA ; “the unemployment picture is a barometer”, albeit a lagging indicator.
- Last week when the Federal Reserve came out with their interest rate decision and is clear they are not going to raise rates any time soon, they see these low rates prolonging even longer than what they had anticipated. Licata said “it does not make sense to put your money in a stale investment” i.e. 30 year bonds and 10 year notes, intimating gold is dynamic and the smart play.
- Late last week India bought 200 tonnes of gold from the IMF and that was seen by the bullion markets as very supportive.
Licata pointed out the simplicity of taking a stand on the direction of gold not by looking at the minutia of ordinary data but rather looking to large and respected miners; “You hear management from companies like Goldcorp and Barrick Gold talking about prices continuing to move higher; I would rather side with the miners who actually have a greater feel for supply than just look at some of the ordinary data.” Licata pointed out that stocks of the miners have tended to lag the price of gold and that they offer a very solid way to play the move in gold.
Seasonal Influences - (WE ARE NOW IN PHASE II)
Traditional gold and silver bull season has only just begun;
1) Gold has a period of seasonal strength from July 12 to October 9th (the trade has been profitable 18 of the past 24 periods).
2) A period of seasonal strength also exists from the first week of November to the first week in February (a trade that has been profitable in 8 of the last 10 periods) for an average gain per period of 13.9%.
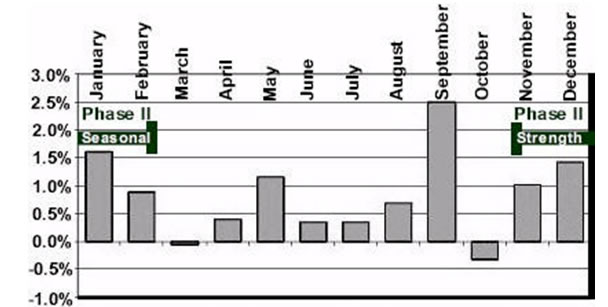
Figure 1. Average Returns in Spot Gold Over the Last Four Decades (excluding 2009 data).
Precious Metals Equities: The Philadelphia Gold and Silver Index (^XAU) has a period of seasonal strength from July 27 to September 25 and has been profitable in 16 of the past 24 periods, outperforming the S&P 500 by an average of 8.4% per period. In the first week of November to the first week of February the Philadelphia Gold and Silver Index has advanced in 7 of the past 10 periods for an average gain of 9.5%.
Review of Top Senior Gold Producers
Gold prices are well above cost of production and many major producers are throwing off large amounts of free cash, have vast reserves, and are still at attractive prices relative to the potential they hold as a hedge against where the dollar they are denominated in may be heading in the long run. As the price of gold rises, positively leveraged gold producers should be well-positioned to earn handsome returns for their shareholders as they derive higher prices for their gold. Below is a review of the top ten gold producers in ascending order of ounces produced. Source Market Equities Research Group Q4 Fall Resource Book and subject company websites/corporate presentations:
First place) Barrick Gold Corp. (NYSE: ABX)(TSX: ABX) Production of 7.2 - 7.6Moz at total cash cost of US$450-475/oz and guidance of 7.7-8.1Moz in 2010. Barrick is the world's largest gold company in terms of market capitalization, annual production, and reserves. The company reported reserves of 138.5Moz at the end of 2008. Current growth projects include Buzwagi, Cortez Hills, Pueblo Viejo, and Pascua-Lama.
Second place) Newmont Mining Co. (NYSE: NEM) 2009 gold sales guidance is 5.2-5.5Moz at costs of $400-440/oz and planned capital expenditures of US$1.5-1.7B. The guidance includes 200-300koz at Boddington from August 2009, but commercial production is likely in November 2009. Newmont is the world's second-largest gold company in terms of production. Yanacocha and Nevada remain Newmont's foundation, but it operates in most other gold-producing regions, including Australia, Canada, Indonesia and most recently West Africa. Reserves were 85.0Moz at December 31, 2008.
Third place) AngloGold Ashanti Ltd. (JSE: ANG)(NYSE: AU) The company forecasts gold production of 4.9 - 5.0Moz in 2009 at cost of US$450-460/oz using R9.25/US$ and US$460-475/oz at R8.50/US$. AngloGold Ashanti is a global gold producer domiciled in South Africa. Production is sources from Africa, Australia and the Americas. Reserves were 74.9Moz at year-end 2008.
Fourth place) Gold Fields Ltd. (JSE: GFI)(NYSE: GFI) the company is targeting a 4Moz per year run rate. Gold Fields Ltd. is a senior gold producer with roughly two-thirds of its production sourced from South Africa. It also has assets in West Africa, South America and Australia. Safety stoppages at Kloof and Driefontein may affect numbers. Total cash costs are expected to increase to US$521-590/oz, mainly due to wage and electricity increases.
Fifth place) Goldcorp Inc. (NYSE: GG)(TSX: G) The company states that over the next five years Goldcorp’s production will increase by over 50%; a growth unparalleled in the gold mining industry. Gold production for 2009 is estimated at 2.3 million ounces at a total cash cost of $365 per ounce excluding by-product credits or US$400/oz on a co-product basis. Strategy for growth is predicated on strong focus on organic growth, no gold hedging, low cost gold producer, maintain a strong balance sheet, focus on low political risk jurisdictions, $95 million exploration budget for 2009.
Sixth place) Freeport McMoRan Copper & Gold Inc. (NYSE: FCX) Projected production in 2009 is 2.4Moz of gold, 56Mlb of molybdenum, 3.9Blb copper (with targeted by-product cash cost of US$0.70/lb). Freeport-McMoRan Copper & Gold, Inc. engages in the exploration, mining, and production of mineral properties primarily in Indonesia, North America, South America, and Africa. It focuses on the copper, gold, molybdenum, and silver prospects; FCX is a market proxy for copper. The 2007 Phelps acquisition diversified the business, but Grasberg remains the key generative asset.
Seventh place) Harmony Gold Mining Co. Ltd. (JSE: HAR)(NYSE: HMY) ~2.2 Moz annual gold production. Through mergers and acquisitions, Harmony has become a significant South African gold producer. The company is restructuring its asset portfolio around core operations in South Africa and growth projects in Southeast Asia. Production and costs are forecast to increase in 2010 with labour costs up 10% and power costs up 35%. In fiscal 2009, labour accounted for approximately 56% of total costs and power around 12%.
Eighth place) Kinross Gold Corp. (NYSE: KGC)(TSX: K) ~1.58Moz annual gold production from what Market Equities Research Group determined for 2008, a review of the corporate website only shows "gold-equivalent" production guidance is 2.3-2.4Moz at average costs of US$390-420/oz NOTE: this is a slight downward revision due to longer-than-expected ramp-up of the Paracatu expansion. Capital expenditures are expected to increase by US$25M to US$500M. Kinross is a senior gold producer with operations located in North America, Brazil, Chile and Russia. The company commissioned the Kupol mine in Russia, and is completing the Paracatu expansion in Brazil and the Buckhorn project in the United States. At December 31, 2008 reserves were 45.6 Moz.
Ninth place) Newcrest Mining Ltd. (ASX: NCM) In FY2010 Newcrest expects gold production in the range of 1.81-1.91Moz and copper production of 83-87kt, with capex of A$805-855M and exploration of A$95-105M. The company forecasts gold production of 2.3Moz by FY2014. Key operations are located in Australia and Indonesia. The company has an extensive development pipeline, including Cadia East, Ridgeway Deeps and Kencana.
Tenth place) Rio Tinto Plc (LSE: RIO)(NYSE: RTP) ~1.23 Moz annual gold production is what was referenced by Market Equities Research Group for 2008 -- Rio Tinto is a diversified metals and mining company and produces gold and silver primarily as by products of their copper operations. The company is the world's second largest producer of iron ore and coal, the third-largest producer of uranium and gem-quality diamonds, the fourth-largest copper producer and the largest aluminum producer. It is also the world's largest producer of bauxite, titanium dioxide slag, borates and talc, and the largest exporter of industrial salt.
Insight on Jr. Miners
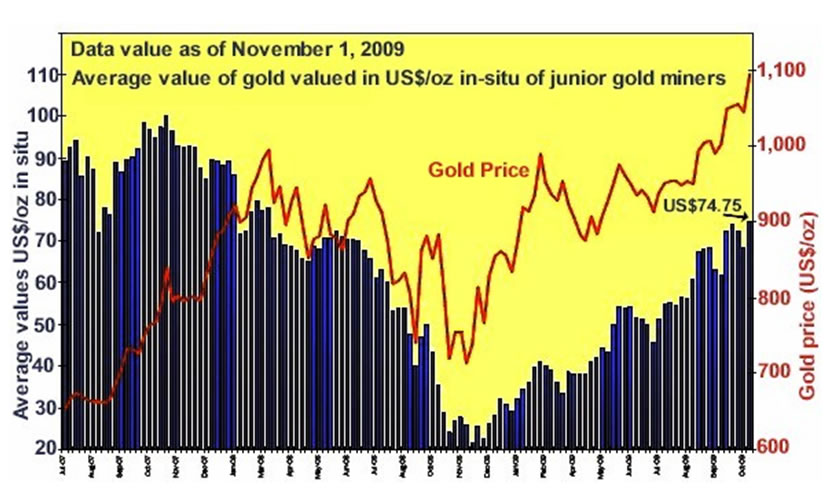
Figure 2: Gold price versus average value US$/oz in situ
Weighted average and ratios used; Canadian$ : US$ conversion = 0.93, Gold : Silver ratio = 63:1, shares outstanding were as of available Q2 2009 numbers.
The chart to the left compares 'the average value of gold in situ for an index of junior/mid-tier gold miners' to 'the price of gold'. The chart clearly shows the divergence that has existed for ~ 1 year and signals bullish opportunity to junior mining equity investors as the equities are justified in upward price revaluation relative to the price of the commodity.
By James O’Rourke
Madison Avenue Research Group
http://madisonaveresearch.com/topgold2010.htm
© 2009 Copyright Madison Avenue Research Group- All Rights Reserved
Disclaimer: The above is a matter of opinion provided for general information purposes only and is not intended as investment advice. Information and analysis above are derived from sources and utilising methods believed to be reliable, but we cannot accept responsibility for any losses you may incur as a result of this analysis. Individuals should consult with their personal financial advisors.
© 2005-2022 http://www.MarketOracle.co.uk - The Market Oracle is a FREE Daily Financial Markets Analysis & Forecasting online publication.
Comments
|
15 Nov 09, 06:51 |
gold
good surveyed report nice job done to make understandable the movement of gold prices,............... |