


Gold Long Run on Route to $2,050 via $1,575
Commodities / Gold & Silver 2009 Nov 15, 2009 - 11:09 AM GMTBy: Merv_Burak

 Boy, you go away for a few days and all hell breaks loose. When last I looked gold was looking weak. Now, three weeks later it’s more than $60 higher. Where to from here?
GOLD: LONG TERM
First, let’s get the long term P&F out of the way. The latest move has smashed through that $1075 projection which leaves us with $1575 next (on its way to $2050). The move over the past few weeks has established a strong bullish P&F chart which would take a considerable effort to reverse. On the long term chart I can calculate another stopping off point, at the $1380 level, as a point of rest on its way to $1575. If I calculate enough projection points I’m bound to guess a few right, and of course THOSE will be the ones I will remember.
As for the normal long term indicators, they are all positive after the actions of the past few weeks. The price of gold remains above its positive sloping moving average line. The momentum indicator remains in its positive zone above its positive trigger line. The volume indicator keeps pushing into new all time highs above its positive trigger line. The long term rating can only be BULLISH.
Although the momentum is in its positive zone, and moving higher, it is still some distance from its previous high levels from early 2008 and even a greater distance from its bull market high of mid-2006. With the price moving steadily higher the momentum of the move is continually getting weaker and weaker. Although one would still go with the flow, towards higher prices, one MUST keep in mind this weakening momentum and be prepared for a major reversal of trend, maybe on the scale of the 2008 reversal. This may not come tomorrow but one should not overlook the possibility sometimes in the future.
INTERMEDIATE TERM
We have a similar situation with the intermediate term indicators. The price continues above its positive moving average line and the momentum continues in its positive zone above its positive trigger line. The volume indicator remains above its positive trigger line. The rating therefore must be BULLISH.
When one is viewing the indicators one must be cognizant of the time period the indicators are based upon. For the momentum indicators one can go back a few years when comparing the long term indicator. For the intermediate term I would not go any further back than a year, maybe two. Any further back and I would rely upon the long term indicator. Although the intermediate term momentum indicator has not yet reached its previous highs from about 2 years ago I would be more inclined to watch its performance since it made a positive divergence and started its positive move at the price lows in Oct of 2008. Since then the indicator has been basically following and confirming the price moves into new highs and at higher lows. Once it starts to deviate from that more recent historical trend then we might have a problem. That has not yet occurred.
SHORT TERM
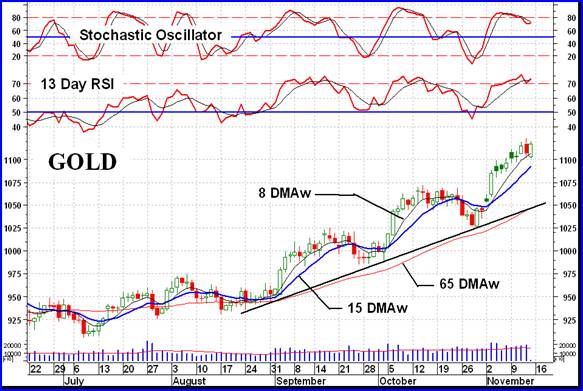
All of the short term indicators appear positive but the move does seem a little too good. It may be time for a short rest but not necessarily a reversal. The price is at new closing highs above its positive sloping moving average line. The momentum indicator is well inside its positive zone but is toying with its trigger line. The daily volume action has been basically above its 15 day average value with the average value continually increasing. All in all the short term rating must be seen as remaining BULLISH.
Having said that, the momentum is in its overbought zone and showing early signs of a topping process. It had moved below its trigger line but closed on Friday just above the trigger. The last two times the short term momentum was at these levels it had topped and reacted for a week or two, that may be what we are looking at again.
As for the immediate direction of least resistance, the Stochastic Oscillator is showing signs of weakness and a possible reversal in the process. It is showing weakness versus its previous move in early October. The drop below its overbought line and its trigger line is an ominous sign. At the present time all this is suggesting is a possible move similar to the mid-Sept or Mid-Oct moves. So I would guess that the downside is the direction of least resistance for the next few days.
SILVER
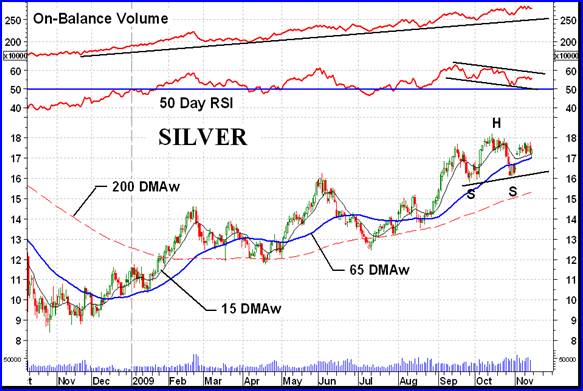
Although from the intermediate and long term standpoint silver is still out performing gold but from the short term standpoint gold has now taken over. This can be seen in the disappointing performance by silver over the past week or so. Silver has been unable to make new highs as gold has been doing. This can easily be seen in a chart comparison between gold and silver. We have a negative divergence in silver at the Oct high and a further weakness in the momentum indicator since then. This has given us a head and shoulder (H&S) pattern. The momentum negative divergence at the head is something I look for to assess the viability of the pattern. Very often this divergence is not there and it therefore makes the pattern suspect. The H&S pattern is not a major pattern and its confirmation would not suggest any major downside move. It could result in a $2 move to about the $14 level which would not be a catastrophe.
PRECIOUS METAL STOCKS
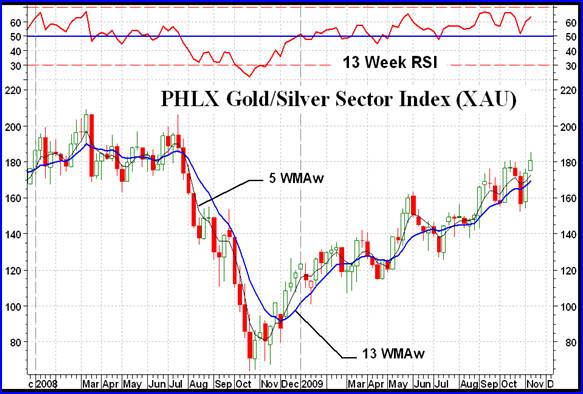
Just for the fun of it I thought I’d show the highest “quality” gold Index (PHLX Gold/Silver Sector Index) and the lowest “quality” gold Index (Merv’s Penny Arcade Index), or as some might call them the show horses versus the dogs. Boy, what a difference a “penny” makes. Of course the comparison is not really fair. The PHLX Index places greater value on its largest stocks, which may not be the best performers, while the Penny Arcade is calculated based upon the AVERAGE weekly performance of all the 30 component stocks. Still, the comparison is interesting. I’ll leave any further commentary for another time.
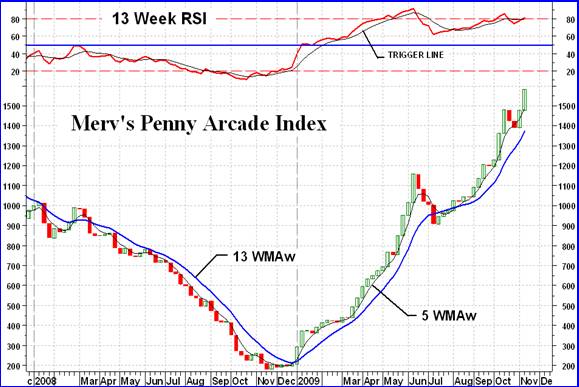
Although it’s been a good couple of weeks for gold and gold stocks most of the North American Indices are still below their all time highs while gold is at new highs. The Merv’s Gold & Silver 160 Index, the Merv’s Qual-Gold Index and the Merv’s Penny Arcade Index are at all time highs while the rest of the Merv’s Indices are also not there yet. Lagging stock prices is not a good thing and one should go forward from here with caution. The Penny Arcade, although showing a terrific performance, is also showing a disconnect between the Index price and the intermediate term momentum indicator. The indicator has not reached new highs and is lagging the Index performance. Again, a warning that something may not be totally right with the gold stock world. HOWEVER, go with the trend as long as it is moving but be prepared to exit should it start to reverse.
MERV’S PRECIOUS METALS INDICES TABLE
Well, I think I’ll call it a week.
By Merv Burak, CMT
Hudson Aero/Systems Inc.
Technical Information Group
for Merv's Precious Metals Central
For DAILY Uranium stock commentary and WEEKLY Uranium market update check out my new Technically Uranium with Merv blog at http://techuranium.blogspot.com .
During the day Merv practices his engineering profession as a Consulting Aerospace Engineer. Once the sun goes down and night descends upon the earth Merv dons his other hat as a Chartered Market Technician ( CMT ) and tries to decipher what's going on in the securities markets. As an underground surveyor in the gold mines of Canada 's Northwest Territories in his youth, Merv has a soft spot for the gold industry and has developed several Gold Indices reflecting different aspects of the industry. As a basically lazy individual Merv's driving focus is to KEEP IT SIMPLE .
To find out more about Merv's various Gold Indices and component stocks, please visit http://preciousmetalscentral.com . There you will find samples of the Indices and their component stocks plus other publications of interest to gold investors.
Before you invest, Always check your market timing with a Qualified Professional Market Technician
Merv Burak Archive |
© 2005-2022 http://www.MarketOracle.co.uk - The Market Oracle is a FREE Daily Financial Markets Analysis & Forecasting online publication.