


ETF Commodities Trading Analysis and Forecasts for GLD, SLV and UNG
Commodities / Commodities Trading Nov 16, 2009 - 01:16 AM GMTBy: Chris_Vermeulen

 Commodities continue to perform well as the US dollar tests the October lows. If we step back and take a look at the weekly charts of the gold, silver, oil and natural gas ETFs we can get a better feel for what to expect in the coming week.
Trading commodity ETFs can be a very fun and profitable experience when done correctly. The first things I always analyze are the longer time-frame charts. This allows me to see past support and resistance levels and determine whether the investment is trending up, down or sideways.
Let’s take a look at gold, silver, oil and natural gas.
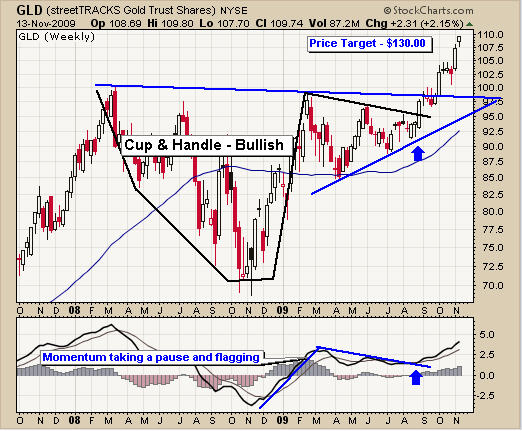
GLD ETF – Weekly Chart
The weekly trend is crucial for understanding the power behind price movements. We can see that the GLD ETF is in a strong up-trend and that price closed at the high on Friday which is a strong sign. I would expect to see gold continue higher on Monday because of this strong momentum.
We can see that over the past 2 years GLD has formed a large cup & handle pattern which is very bullish. A breakout above the handle will trigger investors to buy gold
as a long term investment and that is what we are seeing now.
ETF Trading GLD
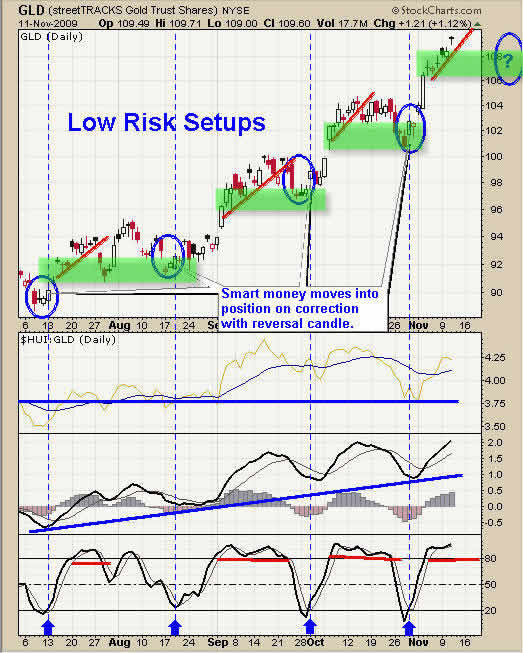
GLD ETF – Daily Chart for Trading the Trend
Using GLD as an example, the trend has been up for several months on the weekly chart. So we know buying low and selling high is the proper strategy for this investment. The weekly chart above shows this.
Buy Signal for GLD – Using the daily chart we focus on buying pullbacks when the price is near a support level and reverses back up.
Profit Taking – I am not a greedy trader so I take profits after a nice run in prices. For GLD a nice short term run is 2-5%. So once I reach that level I start tightening my stops and trend lines to lock in some gains. I do this by selling part of my positions – generally between 25-50%. I let the balance of the position run with the market providing more wiggle room for GLD to mature.
GLD ETF Pivot Low
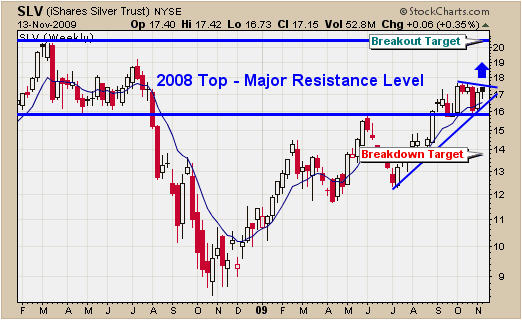
SLV ETF – Weekly Chart
SLV has yet to breakout above the 2008 high. But the chart is still very strong. If we see the price move above the $17.50 level I expect buyers are going to jump in and push prices up to the $20 level.
SLV ETF Trading
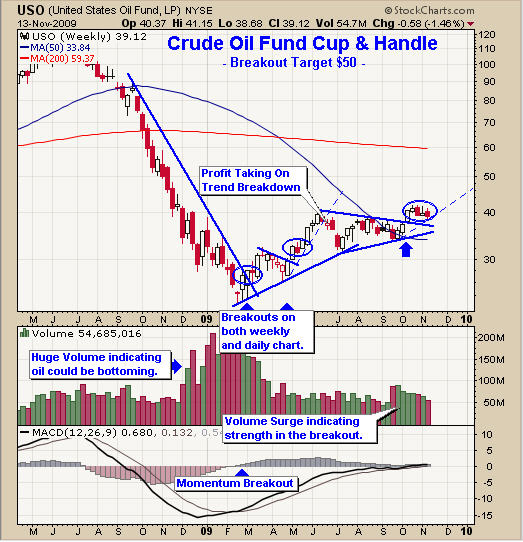
USO Fund – Weekly Chart
The USO fund continues to look bullish as it consolidates the breakout with volume getting lighter. We could see a bounce this week and if we do I will be watching for a low risk entry setup.
Oil ETF Trading
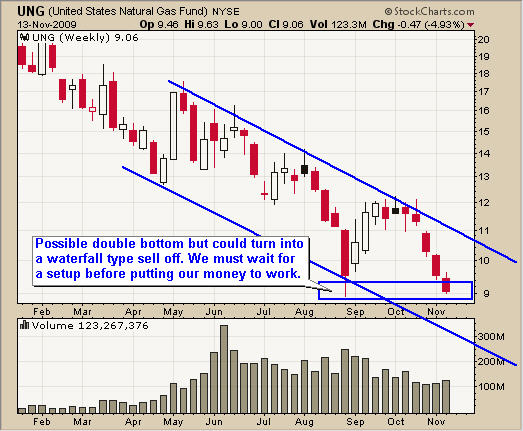
UNG Fund – Weekly Chart
UNG continues to trend down and under perform the market. The last time UNG dropped to this level we had a nice bounce generating a 30% move in 3 weeks. But I don’t think that will happen this time. The price has been sliding lower slowly on light volume. This type of price action is not as predictable when compared to others. I will wait for a proper setup before buying an oversold bounce or shorting after a bounce.
Gas ETF Trading
Commodity ETF Trading Conclusion:
The weekly charts don’t lie. Trade with the underlying weekly trend and you will put the odds in your favor. I use the daily chart and 30 minute intraday charts for timing my trades as those time frames have proven to be very accurate with commodity ETF investments.
WE continue to be hold our golden rocket stocks and GLD fund. If the market co-operates this week we could get some trading signals for both Canadian and US ETF funds.
If you would like to receive my Free Weekly Trading Reports like this please visit my website: www.TheGoldAndOilGuy.com
To Your Financial Success,
By Chris Vermeulen
Chris@TheGoldAndOilGuy.com
Please visit my website for more information. http://www.TheGoldAndOilGuy.com
Chris Vermeulen is Founder of the popular trading site TheGoldAndOilGuy.com. There he shares his highly successful, low-risk trading method. For 6 years Chris has been a leader in teaching others to skillfully trade in gold, oil, and silver in both bull and bear markets. Subscribers to his service depend on Chris' uniquely consistent investment opportunities that carry exceptionally low risk and high return.
This article is intended solely for information purposes. The opinions are those of the author only. Please conduct further research and consult your financial advisor before making any investment/trading decision. No responsibility can be accepted for losses that may result as a consequence of trading on the basis of this analysis.
Chris Vermeulen Archive |
© 2005-2022 http://www.MarketOracle.co.uk - The Market Oracle is a FREE Daily Financial Markets Analysis & Forecasting online publication.
Comments
|
Sara
16 Nov 09, 08:39 |
Trading
variation in trading occurs when silver , bronze cross be gold . I think market now a days not on track due to crisis in all over the world . |