U.S. Real Estate Market Getting Worse
Housing-Market / US Housing Nov 18, 2009 - 07:47 AM GMTBy: Adam_Brochert
 Though I am sure the National Association of Realtors has some statistic indicating that higher real estate prices are "right around the corner" (as they have every single month since before the crash started), real estate is getting worse. Wave 2 of the residential real estate crash is starting on cue and "walking away" from underwater mortgages has reached critical mass.
The "big picture" real estate mortgage situation hasn't changed. There are some efforts to tinker with what must happen in real estate, but the reality is that the losses are coming and cannot be avoided. The private sector knows this, which is why they are scrambling to stuff all the losses down taxpayers' throats.
Moving the mortgage paper to the balance sheet of the private, non-federal, for-profit federal reserve (who will hand it off to Uncle Sam at the opportune moment) and to the balance sheets of Fannie, Freddie, Ginnie, Sallie, the FHA, the VA, the FDIC, the PTA (just kidding...), etc. is the swindle of the day. Any public-backed institution available is being crammed to the gills with ticking time bombs. It is a total scam that has already sewn the seeds of devastation for our economy for a decade to come. There is no escaping it at this point - we have already taken the plunge using the public kitty.
Here's the "big picture road map" chart, which anyone interested in real estate sector fundamentals has seen (chart from Credit Suisse):
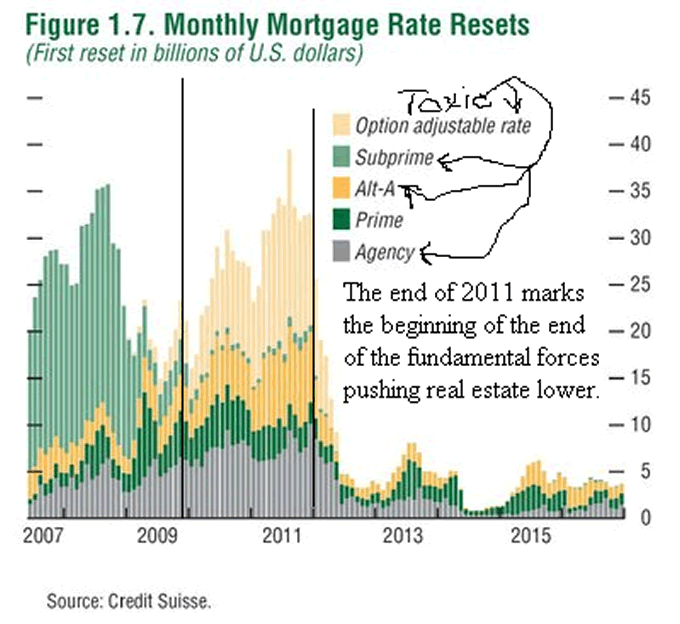
Keep in mind that the mega-spike in Option ARM loans (the majority of which are in California) reflects loans that are not going to have a rate reset, they are going to have a re-cast of their loan terms. In other words, the actual terms on products like "Pick-A-Payment" mortgage loans will change from paying the minimum payment (which is a negatively amortizing, less-than-interest-only payment) to a fixed 30 year principal and interest payment that will double to quadruple the monthly payment for the home "owner" regardless of the interest rate! Low interest rates are irrelevant in this setting and won't help a bit.
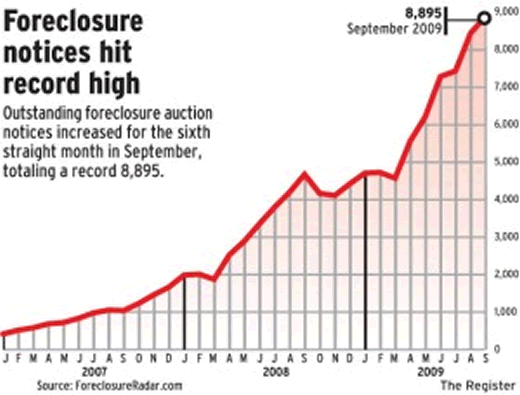
And here's an example of what's happening on the ground in one of the major real estate bubble areas: Orange County, California. Following are two charts, both stolen from this article. The first is foreclosure filings in Orange County, California over the past 2 years or so:
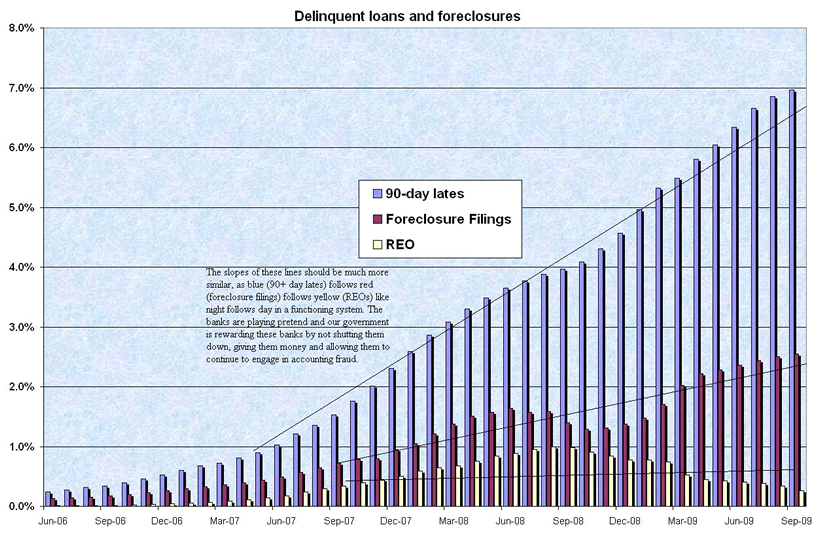
If foreclosure filings are rising in a parabolic arc, how can the bottom in real estate be in? Foreclosure sales are a drag on the price of homes and increase the supply of homes on the market. Economics 101. Tune out the propaganda. The next chart explains why things seem to be stabilizing in some areas. This is a busy chart showing the 90+ day delinquency rate versus the foreclosure notice rate versus the real estate owned by banks rate in Orange County:
Homes are being held off the market as foreclosure filings are being delayed and then the bank is simply not following through with taking back the house. In the mean time, 7% of people in Orange County, California haven't paid their mortgage in at least 3 months! There can be no true recovery in real estate or the underlying economy until this is dealt with realistically. This suspension of economic reality is happening in many areas across the country but is most severe in the bubble areas like California, Florida, Nevada and Arizona. Things will get much worse in residential real estate before they stabilize in these and other areas. The stall tactic is simply a way for banks to get organized enough to pass on the bad paper to the government and the larger banks are playing "chicken" with the federal government once again.
This is good news for those who are renters and/or who are waiting to buy a house. Continuing to save money (preferably in the safest international currency known as Gold) will pay off because money saved today will buy more house tomorrow. We have not reached the capitulation phase in real estate for the "hot" markets. Patience will be rewarded. Even if the federal reserve's hail Mary pass to create inflation works for a while, this inflation will not flow into real estate but will rather move into newly forming bubbles instead (I'm betting on Gold and Gold stocks).
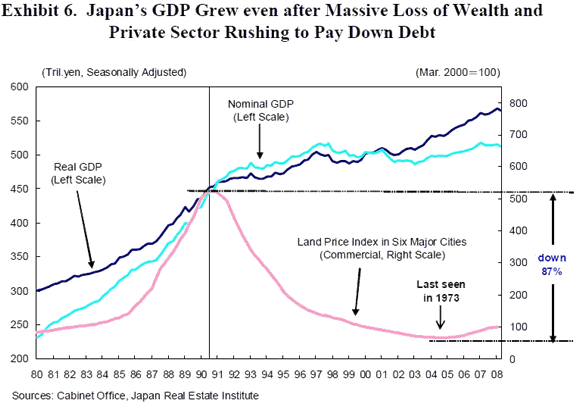
I think 2012 is overly optimistic for a bottom in real estate in most areas. The degree of fraud and covering up is too high and this fraud and hurtful government intervention is delaying the price discovery process needed to establish a true bottom in the marketplace. We've probably got another decade of declining real estate prices, much like what happened in Japan after their bubble burst in 1990 and they did the same covering up of the banking losses (following chart stolen from this Reggie Middleton article):
Many more banks will fail, much lower real estate prices are coming in most major metropolitan areas, and both home prices and rents will continue to decline for at least the next 2-3 years. I'm not even going to go there with commercial real estate today, which will only accelerate the pace of banking losses and failures. It's too early to bottom fish in real estate as an asset class (unique individual opportunities aside). Gold will continue to appreciate in terms of other asset classes like general stocks, corporate bonds, government bonds, most commodities and real estate. When Gold is used as the currency of measurement, deflation has been here for a while. It is only when fiat paper currencies are used that the inflation-deflation debate is confusing and more complex.
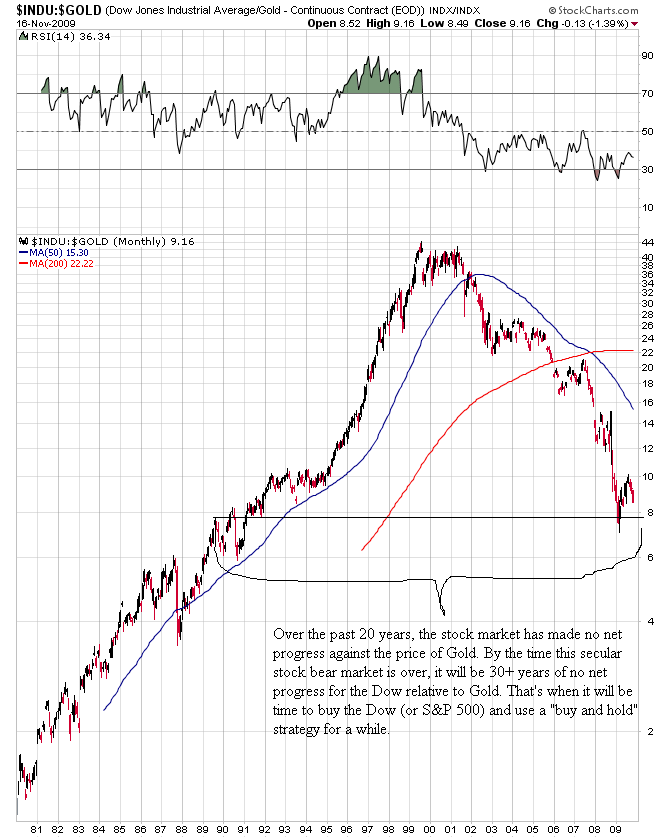
Here's the Dow Jones Industrial Average "deflated" by the price of Gold over the past 30 years:
People who scoff at the Dow to Gold ratio (i.e. paperbugs) are the same folks that listen intently when they are told that secular stock bear markets end with a price-to-earnings ratio of less than 10 (we're somewhere in the 80s right now) and a dividend yield of at least 5%. You can use these latter measures if you prefer, but we're a long way from the bottom in general stocks (and real estate) no matter how you look at it.
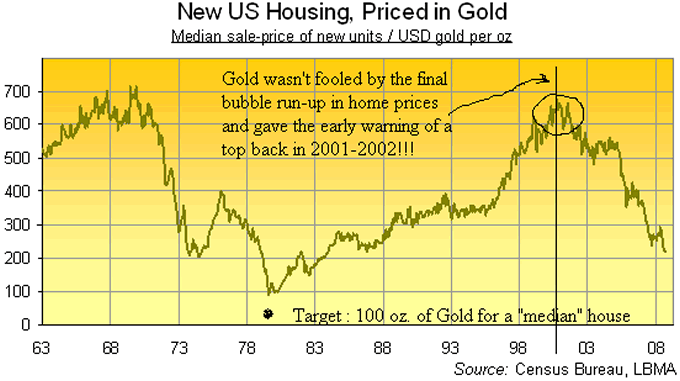
And here are U.S. home prices deflated by the price of Gold over the past 45 years (chart stolen from Adrian Ash at bullionvault.com):
By just burying a piece of shiny metal in the backyard, one will continue to become wealthier due to purchasing power gains in terms of real estate, corporate bonds and general stocks. What could be easier?
Visit Adam Brochert’s blog: http://goldversuspaper.blogspot.com/
Adam Brochert
abrochert@yahoo.com
http://goldversuspaper.blogspot.com
BIO: Markets and cycles are my new hobby. I've seen the writing on the wall for the U.S. and the global economy and I am seeking financial salvation for myself (and anyone else who cares to listen) while Rome burns around us.
© 2009 Copyright Adam Brochert - All Rights Reserved
Disclaimer: The above is a matter of opinion provided for general information purposes only and is not intended as investment advice. Information and analysis above are derived from sources and utilising methods believe
© 2005-2022 http://www.MarketOracle.co.uk - The Market Oracle is a FREE Daily Financial Markets Analysis & Forecasting online publication.


