


Weekly Gold and Silver Technical Analysis Report -15th July 2007 - Technically Precious with Merv
Commodities / Gold & Silver Jul 15, 2007 - 12:01 PM GMTBy: Merv_Burak

Nice little rally in the precious metals but for now the emphasis is on the “little”. Rallies happen, longevity is rare. Let's take a closer look.
U.S. DOLLAR INDEX
Before going into a gold analysis, a few words about the U.S. Dollar Index shown here two weeks ago. Over the past two weeks the $ Index has moved lower and is sitting right on top of its indicated P&F support, at 81. As mentioned, it has been here several times in the past 20 years with significant rallies following. Only once had it dropped below this P&F support but then only for a couple of short weeks. Looking at a daily futures chart we see that the dollar is below the 81 level, more than half way towards the 80 level. Momentum is negative and the volume action seems to suggest that no one likes the $. What should we expect if the $ should drop decisively below support?
Well, it would then be in sort of no-man's land and it's anyone's guess what to expect. Is this the $ collapse that we have been hearing so much about in recent years from an abundance of experts? When the $ first started its decline in 2002, from above the 120 level, one could have calculated a long term P&F projection to the 80 level, where it is basically at right now. Should the $ break below support then a continuation projection could be calculated and take us all the way down to the 60 level. That would be a 25% drop and from here may not seem that horrible, but from the 2002 top that would be a 50% drop in value for the US $ Index and represent a serious devaluation of the US$ versus a staple of world currencies. Possible interesting times ahead.
GOLD : LONG TERM
From the viewpoint of the long term P&F chart gold has not made any further move versus the chart shown two weeks ago. The long term P&F position remains bullish with projections to $780 and then to $915. To reverse this bullish scenario, a move is still required to the $600 level.
As for the normal indicators, well they are all starting to look a little better although more strengthening is required. Gold itself has moved above its long term moving average line and the line is oh so slightly turning upwards. Long term momentum (using a daily chart) is still above its 50% neutral line but only slightly so. The recent rally in gold has not been that impressive as far as momentum is concerned. The long term volume indicator, although going through a minor rally itself, is still below its trigger line for a still negative reading.
In my last commentary, two weeks ago, I had down graded the long term gold to a NEUTRAL rating. I will upgrade it this week to a + NEUTRAL rating pending some better market action.
INTERMEDIATE TERM
On the chart below one can see the as yet unremarkable rally of the past couple of weeks. Should the US $ continue to weaken then maybe we will see a hell of a lot more strength here, but it's a wait and see game. Although gold has just moved above its intermediate term moving average line the line remains slightly negative. The intermediate term volume indicator moved above its trigger line this past week and the trigger has just turned positive. The interesting story is in the lateral neutrality of the momentum indicator. For more than a year now it has been trapped in a relatively narrow band, between 45% on the down side and 60% on the up side. On the average this is a trend that is very slightly on the positive side but not enough to get all, excited about. We'll know we're in a good rally when the momentum zooms through that 60% level, but that's some distance away yet.
The price action over the past year or more is also interesting. It is not unusual that after a plunge from a new high we get a sharp rally. These two points, the plunge low (last June) and the rally high (last July) are often not penetrated until a new move begins, after some time consolidating the previous bull move. This looked like the case in Feb but the subsequent high in April was accompanied by a lower low in the momentum indicator (a negative divergence). We still have not been able to get any real steam for a sustained new bull market.
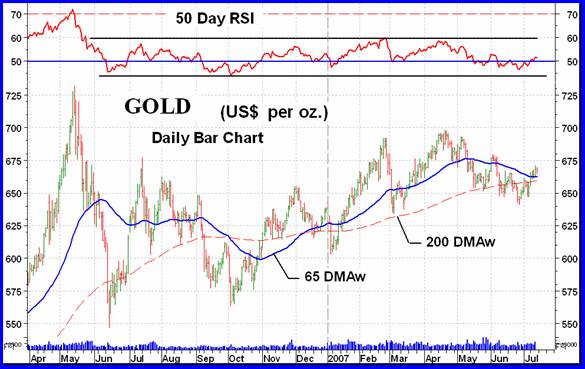
Although things are starting to look a little brighter I cannot yet go all the way to a new bull rating so will upgrade the intermediate term to NEUTRAL for this week.
SHORT TERM
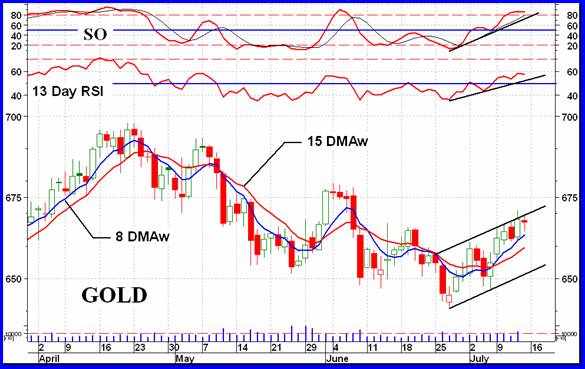
We have been in a short term rally mode for about three weeks now but longevity seems to be a potential problem from here. Gold just seems to be butting its head against a resistance and from here my guess is that we are looking for a reaction more so than an up trend continuation. However, the price is still above a positive short term moving average line and momentum is in the positive zone, above its up trend line, so one would remain with the trend until the trend has changed. It's difficult to see at what point one would say the trend has changed, this requires a little more action and daily watching.
IMMEDIATE TERM
So, Monday or Tuesday, what to expect? The Stochastic Oscillator is in its overbought zone and flattening out. The price action over the past few days has been like a topping action, unable to move higher but not yet moving lower. Although the indicators are still positive I would be looking for a lateral few days of action or possibly even lower action. A close below $661 would indicate the immediate term has reversed to the down side.
NORTH AMERICAN GOLD INDICES
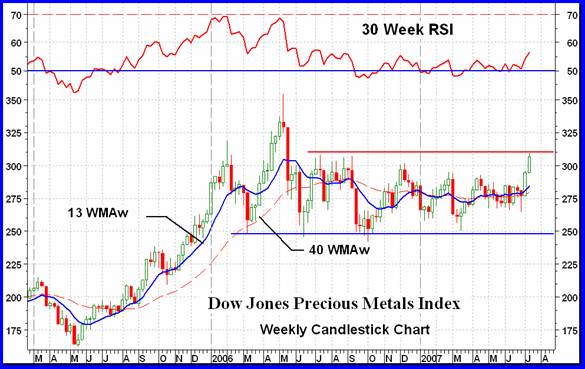
We're back to the Dow Jones Precious Metals Index (DJPM) in my revolving weekly look at the major Indices. The DJPM Index is similar in performance to the other major Indices. They all have their little idiosyncrasies but all are telling basically the same story. When one has been accustom to working with the Merv's Indices, ALL of which had exceeded their May 2006 highs and some by quite a bit, the thing that jumps out when looking at the major Indices is that none have yet exceeded their lateral resistance levels, least of all their May 2006 highs. This difference in the average performances of the Merv's Indices and the weighted performances of the majors is sort of balanced out with the Composite Index of Precious Metals Indices, shown in these commentaries from time to time (last shown in 22 June 2007). There we had seen the Composite made a very strong potential double top. Although the past two weeks has seen the composite move back to the up side it is still below the potential double top level.
The past two weeks has seen some good moves in this Index. Now the question is, “is this like Sept of 2005 with a lot of upside still to go or is it like June 2006 with no upside to go?” The Index move does look impressive and it may be telling us that the gold stocks are ready for a new bull, at least the larger ones whose weighting propels the Index.
MERV'S PRECIOUS METALS INDICES
I mentioned the Composite Index above. It is within a week or two of breaking through the potential double top resistance level to nullify the potential, but that is still in the future. An interesting note, the long term momentum for the weighted major Indices have been bouncing above and below their neutral lines for some time now (see the DJPM Index on the previous page). The long term momentum for the average Merv's Indices have continued above their neutral lines for a continuous positive reading ever since the start of the latest bull move in May/June of 2005. As I said, just an interesting note.
MERV'S GOLD & SILVER 160 INDEX
Well, let's see what the universe of 160 has been up to these past two weeks. I guess the most important point about the past two weeks, other than the positive trend, was my extreme speculation criteria. When we get to the point of extreme speculation we are then in danger of a serious reversal of trend. My criteria of this is to see how many stocks have advanced or declined more than 30% during the week. With 160 stocks and a large number of them speculative stocks, the larger the number of stocks in this category then the higher potential for a serious reversal. It is noted that although we have had two good weeks of the gold stock market there were no stocks in this category either week. So, although the stocks are moving they are not in a panic mode, suggesting that the speculative activity is calm and cool. This might suggest that there might be a lot more upside to come.
Looking at the indicators, the Index is above both its intermediate and long term indicators with the moving average lines now turned up. Momentum indicators are also both in their positive zones. From the chart both time periods may be considered as BULLISH.
With 113 advancing stocks (71%) and only 42 declining stocks (26%) it was a somewhat lopsided week, but lopsided in the right direction. Despite the fact that the long term indicators remained in there positive zones the summation of individual stock ratings went bearish some weeks back and is now only neutral with neither the bull or bear summation over the 50% mark, this for the long term. As for the intermediate term that summation of individual stock ratings is now in the BULLISH camp with 55% of the stocks rated as positive.
MERV'S QUAL-GOLD INDEX : MERV'S SPEC-GOLD INDEX : MERV'S GAMB-GOLD INDEX
The previous week we had the normal quality week with the higher the quality the better the performance. This past week it was a mish-mash with no discernable trend, Qual-Gold gain of 2.0%, Spec-Gold lower at 1.7% while Gamb-Gold higher at 2.8%. Of the three the Gamb-Gold Index is best placed to move into new all time high territory. It is just 0.3% below the previous all time high. While the majors are still some distance below their May 2006 highs (see the DJPM Index on the previous page) the Gamb-Gold Index is 23.4% ABOVE its May 2006 high. As I had shown here a few weeks back, “quality” losses about the same percentage as do the more speculative stocks in a bear market BUT during a bull market there is just no comparison on the upside performance. The speculatives have it all over the “quality”.
Although the gains in the Indices were somewhat hap-hazard the advancing/declining stocks were not. The higher quality Index had the greater number of advancing issues while the lowest quality Index had the least advancing issues, during the week. The Qual-Gold Index had 25 advancing stocks (83%) and 5 declining ones (17%). The Spec-Gold Index had 23 advancing stocks (77%) and 7 decliners (23%) and the Gamb-Gold Index had 17 advancing stocks (57%) and 11 decliners (37%).
The activity over the past two weeks has turned the charts into one big happy family with all the indicators turned into the positive mode. So, for all three Indices and for the two time periods, intermediate and long term, the charts have turned BULLISH.
As for the summation of individual stock ratings we have them all moving towards the plus side with all three Indices in the BULL camp for the short and intermediate term BUT all three still not quite there for the long term. All three are rated as NEUTRAL for the long term with neither the bull nor the bear in control, maybe next week.
SILVER
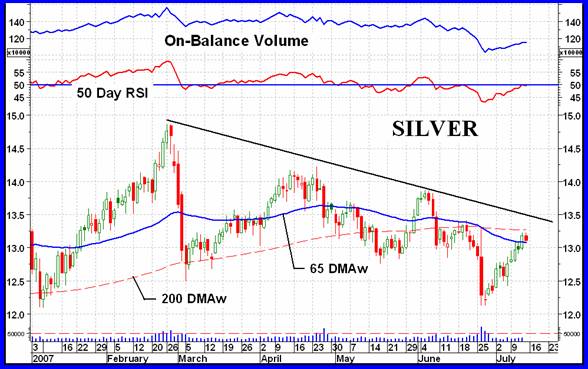
Silver has been in a little rally over the past few weeks similar to gold (and with slightly better weekly gains than gold). However, the chart still does not leave one with any great felling of confidence that the rally will have longevity. Volume is normally a good sign of speculative interest and when combined with the price movement one should normally be able to guess on which side that interest was on. That being said, in futures activity there is always the end of contract month activity that skews the volume picture. The past few weeks has not been a period of end of contract activity and therefore the very low volume may be telling us that the rise in silver futures has been on very little speculative interest.
As we stand today silver has closed just slightly above its intermediate term moving average line but the line is still very slightly pointing lower. Intermediate term momentum is toying with its neutral line but finished on Friday just a shade below. The combination of volume and price, as reflected in the On-Balance Volume indicator, is moving higher but at a very pathetic pace.
All in all, not impressed with the silver action to date. We need some more enthusiastic upside action over the next week or two or else the direction may change back to the down side.
MERV'S QUAL-SILVER INDEX : MERV'S SPEC-SILVER INDEX
Despite the lack of real strength in the silver move the two silver Indices have been doing quite well. For the past two weeks they have been about the best performers of the Merv's Indices. The Qual gained 2.7% and the Spec gained 3.9% this past week. As for the winners and losers, there were 7 Qual winners (70%) and 3 losers (30%) while on the Spec side there were 17 winners (68%) and 8 losers (32%). Except for the long term Qual-Silver Index the two silver Indices had a similar performance as far as the summation of individual stock ratings were concerned. The ratings moved more into the positive with the intermediate and short term for both Indices being in the BULL ranks. On the long term the Spec-Silver is in the NEUTRAL camp the same as the gold Indices but the Qual-Silver has now moved into the BULL side.
Looking at the charts one sees all the indicators have now gone over into the positive side so both Indices are considered as BULLISH for both time periods.
MERV'S PRECIOUS METALS INDICES TABLE
Well, that's it for this week.
By Merv Burak, CMT
Hudson Aero/Systems Inc.
Technical Information Group
for Merv's Precious Metals Central
Web: www.themarkettraders.com
e-mail: merv@themarkettraders.com
During the day Merv practices his engineering profession as a Consulting Aerospace Engineer. Once the sun goes down and night descends upon the earth Merv dons his other hat as a Chartered Market Technician ( CMT ) and tries to decipher what's going on in the securities markets. As an underground surveyor in the gold mines of Canada 's Northwest Territories in his youth, Merv has a soft spot for the gold industry and has developed several Gold Indices reflecting different aspects of the industry. As a basically lazy individual Merv's driving focus is to KEEP IT SIMPLE .
To find out more about Merv's various Gold Indices and component stocks, please visit www.themarkettraders.com and click on Merv's Precious Metals Central . There you will find samples of the Indices and their component stocks plus other publications of interest to gold investors. While at the themarkettraders.com web site please take the time to check out the Energy Central site and the various Merv's Energy Tables for the most comprehensive survey of energy stocks on the internet. Before you invest, Always check your market timing with a Qualified Professional Market Technician
Merv Burak Archive |
© 2005-2022 http://www.MarketOracle.co.uk - The Market Oracle is a FREE Daily Financial Markets Analysis & Forecasting online publication.