US Bond Market and Interest Rates Quarterly Review and Outlook - Second Quarter 2007
Interest-Rates / US Bonds Jul 17, 2007 - 01:26 AM GMTBy: John_Mauldin
 This week in Outside the Box, we take a closer look at the bond market and its underlying drivers. HMIC's Van Hoisington and Dr. Lacy Hunt anticipate lower inflationary pressures on account of faltering consumer spending and further deterioration in the housing market.
Hoisington Investment Management Company focuses on long-term investment strategies based on Economic Analysis. The firm is a registered investment advisor specializing in fixed income portfolios with over $3.5 billion under management for large institutional clients. Van R. Hoisington is the President and Chief Investment Officer and has produced an outstanding fifteen-year performance record. Dr. Lacy Hunt, an internationally known economist, joined the firm in 1996 adding depth and expertise with his in-depth research and analysis.
Today's article is from their Second Quarter Review and Outlook which I am delighted to present to you with their consent. While constructing their assessment for bonds, Van and Lacy walk through each building block, providing analysis on the predominant driving factors in the bond market and their respective implications.
John Mauldin, Editor
Quarterly Review and Outlook Second Quarter 2007
by Van R. Hoisington and Lacy H. Hunt, Ph.D.
FISCAL YEAR REVIEW
Long-term interest rates declined slightly in the fiscal year ending June 30, creating a small capital gain in addition to the coupon return. Long-dated Treasury portfolios such as HIMCO's registered a 6.4% return compared with the 6.1% return of the Lehman Aggregate Bond Index. Investment in the long end of the Treasury market has also been profitable for investors over the past three and five year periods as HIMCO returned 6.8% and 7.3% respectively, compared with 4.0% and 4.5% for the Lehman Aggregate Index. The sharp sell-off in the bond market in the second quarter dragged long maturity portfolios to a negative 2.4% return, versus a 1% gain in the Lehman Aggregate Index in the first half of the year; however, the current economic fundamentals suggest that a major bond rally will ensue in the last half of 2007.
LAST BOUNCE
Second quarter GDP showed an improvement from the paltry 0.7% first quarter growth rate. Two major sectors were the proximate cause for the improvement. First, inventories, which were negative in the first quarter, were rebuilt noticeably in the second quarter, particularly in the automobile sector. The approaching expiration of the auto workers' labor contracts in September was a strong motivating factor for the auto inventory build. Second, the trade deficit improved, primarily because imports stalled. Perversely, as this improvement in GDP was being registered, the underlying conditions of the economy worsened, pointing to likely recessionary conditions late this year or early next year.
HOUSEHOLD CONTRACTION
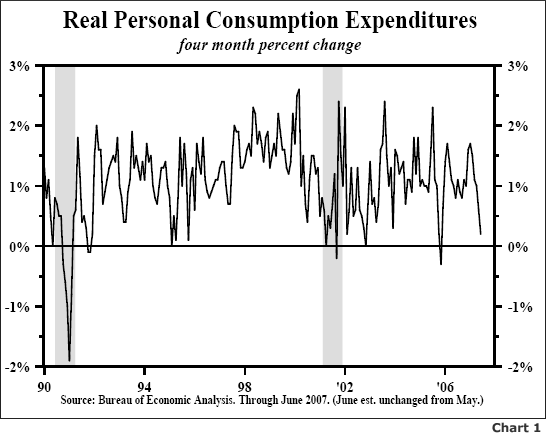
Real personal consumption expenditures (PCE) represented about 68% of U.S. economic activity in the first quarter. Thus, any shift in the consumer's desire to save rather than spend will have significant consequences for economic growth. Real PCE in June is estimated to have been flat. If realized, consumption for the past four months will be essentially unchanged at .2% (Chart 1). This extended period of flat sales suggests that two events have finally conspired to halt the seemingly indefatigable consumer:
- a softening labor market and lower income growth, and
- falling home prices and tighter lending standards.
SOFTER LABOR MARKETS
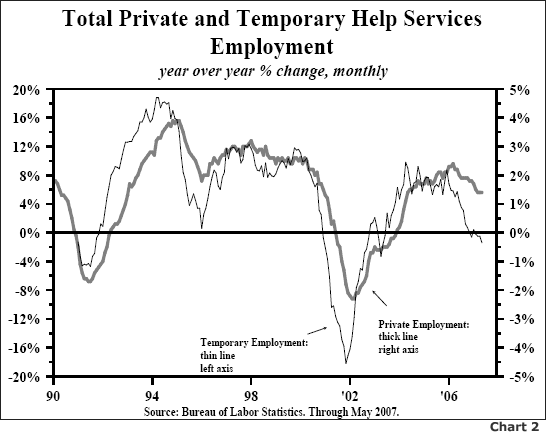
Growth in non-farm payrolls this year has averaged 145,000, down from the 2006 monthly average pace of 189,000. Despite this noticeable slowdown, these numbers undoubtedly understate the deterioration. Non-farm household employment (population and payroll-adjusted by the BLS), an alternative jobs measure that historically has been more accurate at cyclical turning points, expanded 45,000 per month this year compared to a 235,000 average monthly gain in 2006, an 80% decline. Further, employment at temporary help agencies, which has led employment in the past, declined this year (Chart 2).
The weaker employment trends may explain why the Conference Board's measure of consumer confidence has dropped to its lowest level in ten months, although $3.00 gasoline may also be a factor. Real disposable income has fallen at a 1.5% annual rate in the three months ending in May, dampening spending as well. Auto sales in the second quarter contracted at a 13% annual rate from the first quarter to the lowest sales level since the fall quarter of 1998. Johnson Redbook Research reports that same store retail sales were up 1.6% in June versus a year ago, well below the 3.3% and 3.8% gains posted for June, 2006 and June, 2005 respectively. The International Council of Shopping Centers also confirms this weak pattern of retail sales. Obviously the consumer has retrenched, and an extended slowdown is expected, not only from fewer jobs but also because of problems in the housing sector.
HOUSING DEPRESSION
In recent years equity extraction from homes generated a huge pile of consumer cash that was allocated to spending, investments, and a variety of other uses. While the exact allocation of this massive sum is unknown, total home equity cash out (as determined by Freddie Mac) summed to $1 trillion over the five years ending 2006, an amount equal to 45% of the rise in total PCE over this same period. That source of cash has largely dried up since home prices are no longer rising, and credit standards have been tightened.
According to Case/Shiller, home prices have fallen at a 5% annual rate over the past six months, now deflating in 3/4 of the country's individual markets. In the past year, home prices decreased 2.7%, the steepest decline in 16 years, and further declines seem certain. At the end of the first quarter, vacant homes for sale, plus unsold new single family homes under construction, surged to 2.454 million, an unprecedented one million above the ten year average from 1994 to 2004.
Pending home sales have just recorded the largest three month drop in history, and are now down 12.9% from a year ago. Single family permits for new construction slumped to a ten year low, reflecting the attitude of the National Association of Home Builders, whose index hit a sixteen year low. The great ATM machine (home equity extraction) for consumers has enabled spending beyond income for several years, but it has now been disabled. This strain on consumers, combined with their negative saving rate and over-indebtedness, is already apparent in the current spending pattern and in rising delinquencies and defaults on mortgages.
First quarter loan delinquencies worsened to 2.42% according to the ABA, the highest rate since the 2001 recession. New tougher guidelines on home borrowing were just issued last month resulting in reduced credit availability to the consumer. In addition, sub-prime brokers have expired by the dozens, making credit unavailable for many who previously could borrow. Moreover, several hedge funds have closed their doors due to the indirect impact of defaulting homeowners. These closures can have important repercussions for consumers since financial institutions historically raise credit requirements when losses occur.
Since more than $1.8 trillion of securities backed by sub-prime mortgages were created by Wall Street firms over the past six years (according to the Wall Street Journal ), the magnitude of the problem may be larger than many realize. The press has reported that a substantial portion of the collateral for all sub-prime mortgage bonds had either payments at least 90 days late, were in foreclosure, or had the underlying property seized. Further, Alt-A mortgages, the credit category between prime and sub-prime, have experienced a rise in delinquencies from .91% on 2004 loans to 4.21% on 2006 loans. Thus, even the more qualified borrowers are having problems meeting their monthly payments. The cycle of foreclosures, stress on financial institutions, higher credit standards, reduced demand for homes, and lower home prices all serve to depress consumer spending, the overwhelmingly dominant U. S. sector.
GLOBAL IMPACT
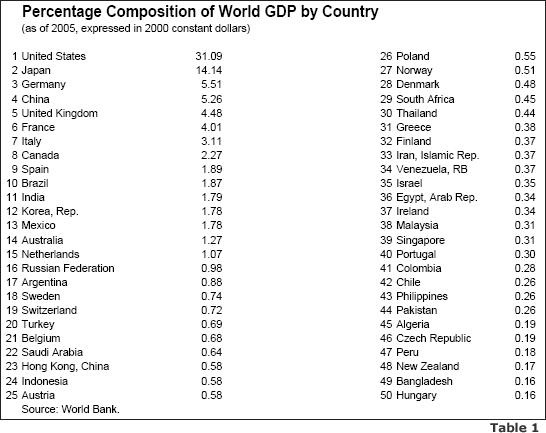
It is incorrect to believe that the rest of the world is strong enough to boost our exports and keep our economic activity on an even keel in the face of a slowdown in U.S. consumer spending. Importantly, real exports constitute only about 11% of economic activity, versus 68% for real PCE. Thus, a massive lift in exports would be needed to keep the economy expanding in the face of consumer retrenchment. However, the statistics and economic history suggest that world growth causality runs from the U.S. to the world, not vice versa. The World Bank provides a breakdown of world GDP in real terms (Table 1). At present, the world is a mix of rapidly growing and significantly underperforming economies, with the BRIC (Brazil, Russia, India, China) countries on the high growth side and Japan, the United States, and those closely aligned with the U. S. on the slow side.
The rest are largely somewhere in between these strong and weak groups. The United States accounts for 31% of world GDP with Japan next in line with 14.1%, meaning these two countries account for 45.2% of total world output. The BRIC countries, on the other hand, control 10% of global output. Although Mexico and Canada diverge from the United States over shorter intervals, over the long run they are tied to the fortunes of the United States. Adding those figures to the United States and Japan boosts the total to 49.3% of global GDP, a figure that easily rises to about 50% if one takes into account the Latin American countries influenced more by the United States than any other country.
But even this analysis is not a complete description of the impact of the United States on the global economy. A main source of Chinese growth is their burgeoning trade surplus, most of which is with the United States. According to official Chinese figures, the Chinese had a record trade surplus for the first half of this year of $112.5 billion, with $73.9 billion or 65% with the United States. U.S. records indicate that its deficit with China is bigger than the official Chinese figures show. The boost to Chinese GDP is even greater when one takes into account the foreign trade multiplier, or indirect economic effects. It then becomes clear that the Chinese trade surplus against the U.S. has been a powerful stimulant to their economy. They will indeed feel the slowdown in U.S. consumption. The U.S. trade deficit also plays a major role in domestic economic growth for India and Brazil, not to mention Europe.
Econometric studies provide important insight into the global impact of the U.S. economy. These studies have shown that U.S. imports increase $2 for each $1 rise in income, but that U.S. exports go up just $1 for each $1 gain in foreign income. Thus, when U.S. consumption is accelerating the world economy is a major beneficiary, but when it slows, as it is now doing, the rest of the world will lose forward momentum. This relationship explains why U.S. domestic demand leads the domestic demand in the large foreign economies by six to nine months (Chart 3).
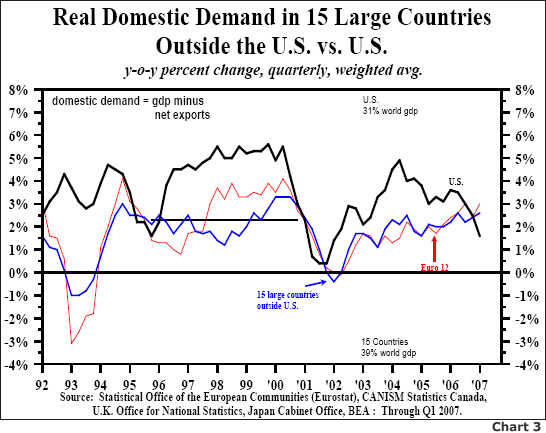
In the second quarter real domestic final sales slumped in the United States and U.S. imports fell, aligning with the econometric studies. Industrial production has contracted for three straight months in Japan, and Germany registered a net decline over the past two months. Thus, the process of transmitting U.S. weakness to the rest of the world has begun.
WORLD FINANCIAL MARKETS
The global slowdown that is expected over the next year or so will inevitably elicit financial strains. Included in the discussion of the potential difficulties are the large U.S. trade deficit and the $16.3 trillion of U.S. assets owned by the rest of the world [June 2006 data]. Some suggest this large indebtedness leaves the U.S. financially dependent on conditions in those countries that hold our debt. If their interest rates rise, the U.S. rates must also increase or the claims against the U.S. will be liquidated. This analysis, however, is flawed.
First, the U.S. position is not so dire. The United States holds $13.8 trillion in claims against the rest of the world, resulting in a net indebtedness of $2.5 trillion. Relative to GDP, this sum is about 19%, a somewhat lower figure than the typical family mortgage expressed as a percentage of family income. This net debt has been virtually unchanged since 2001.
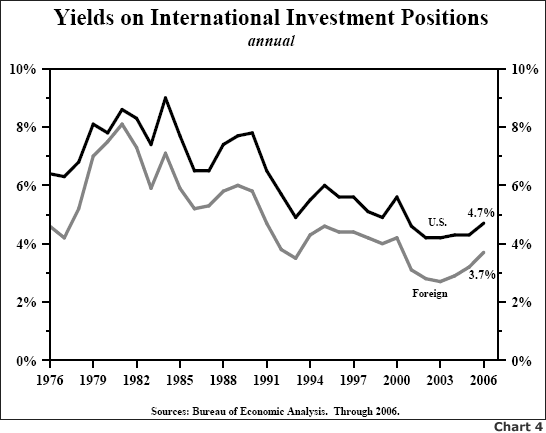
More important to the dollar and cross border interest rates, U.S. income on its $13.8 trillion of assets exceeded the payments on the $16.3 trillion in U.S. liabilities, something that has happened every year since 1960. Last year, the income on U.S. assets yielded 4.7%, a full percentage point higher than the yield on our liabilities and similar to the differences since 1976 (Chart 4). Therefore, cash flow from U.S. assets more than funded the cash requirements for U.S. liabilities.
Second, to whom would the foreign dollar assets be sold? The system is closed. If one set of foreigners sold, then another set of foreigners would be the buyers.
INTEREST RATES
The United States is still the world's marketplace. Even if it were not, domestic inflation and interest rates will continue to be determined within the confines of the U.S. monetary and growth models, as is documented in macroeconomics. Both these models are pointing in the direction of weaker U.S. growth, and by implication a spillover is expected to impact the rest of the world. The United States is the world's largest debtor, but U.S. investment flows remain in favor of the United States, indicating that the U.S. is still master of its own economic future.
In today's global markets, what can be said about the nature of the short and long-term Treasury markets? In the under five year portion of the market there are two major players: the Fed and foreign official entities (including the Chinese), with the Fed dominating. If the Chinese place $3 billion with a private equity group (a process already begun), these funds would be directed away from the short end of the Treasury market. The long end of the market would be unaffected since the Chinese role is minimal in that sector. Moreover, the funds allocated to private investment would most likely be from future Chinese trade surpluses, meaning that such investments will be funded from new cash flows, and not taken from existing investments.
The longer end of the Treasury market will continue to be dominated by private investors, both domestic and foreign. In mid-2006, foreign official institutions only held 3.1% of their portfolios in Treasury maturities of ten years and longer, or about $38 billion of their total holdings of $1.213 trillion. As such, foreign official institutions held a paltry 8.6% of the $439 billion of ten year and longer term Treasury bonds outstanding at mid-2006. Long maturities will continue to be controlled by the Fisher equation which says the risk-free, nominal bond yield is equal to the real rate plus expected inflation. Econometric research, including our own, indicates that the bond yield is determined over time by inflationary expectations.
A host of considerations can cause yields to gyrate wildly over the near term, but these considerations are unimportant over time. Rational investors, whether domestic or foreign, will determine inflationary expectations and invest accordingly. Our view is that faltering consumer spending and a continuing housing recession will lead to recessionary conditions in the quarters ahead. This will negatively impact global economic conditions and decrease the U.S. inflation rate from its already modest 1.9%, thereby lowering inflationary expectations, and subsequently long bond yields.
Van R. Hoisington
Lacy H. Hunt, Ph.D.
I hope you have found the quarterly report insightful.
Your concerned about the possibility of recession analyst,
By John Mauldin
http://www.investorsinsight.com
To subscribe to John Mauldin's E-Letter please click here: http://www.frontlinethoughts.com/subscribe.asp
Copyright 2007 John Mauldin. All Rights Reserved
John Mauldin is president of Millennium Wave Advisors, LLC, a registered investment advisor. All material presented herein is believed to be reliable but we cannot attest to its accuracy. Investment recommendations may change and readers are urged to check with their investment counselors before making any investment decisions. Opinions expressed in these reports may change without prior notice. John Mauldin and/or the staff at Millennium Wave Advisors, LLC may or may not have investments in any funds cited above. Mauldin can be reached at 800-829-7273.
Disclaimer PAST RESULTS ARE NOT INDICATIVE OF FUTURE RESULTS. THERE IS RISK OF LOSS AS WELL AS THE OPPORTUNITY FOR GAIN WHEN INVESTING IN MANAGED FUNDS. WHEN CONSIDERING ALTERNATIVE INVESTMENTS, INCLUDING HEDGE FUNDS, YOU SHOULD CONSIDER VARIOUS RISKS INCLUDING THE FACT THAT SOME PRODUCTS: OFTEN ENGAGE IN LEVERAGING AND OTHER SPECULATIVE INVESTMENT PRACTICES THAT MAY INCREASE THE RISK OF INVESTMENT LOSS, CAN BE ILLIQUID, ARE NOT REQUIRED TO PROVIDE PERIODIC PRICING OR VALUATION INFORMATION TO INVESTORS, MAY INVOLVE COMPLEX TAX STRUCTURES AND DELAYS IN DISTRIBUTING IMPORTANT TAX INFORMATION, ARE NOT SUBJECT TO THE SAME REGULATORY REQUIREMENTS AS MUTUAL FUNDS, OFTEN CHARGE HIGH FEES, AND IN MANY CASES THE UNDERLYING INVESTMENTS ARE NOT TRANSPARENT AND ARE KNOWN ONLY TO THE INVESTMENT MANAGER.
John Mauldin Archive |
© 2005-2022 http://www.MarketOracle.co.uk - The Market Oracle is a FREE Daily Financial Markets Analysis & Forecasting online publication.


