


The Financial Markets Big Picture - The Crack-up Boom Series Part VI
Stock-Markets / Financial Markets Jul 17, 2007 - 09:15 PM GMTBy: Ty_Andros

In This Issue
1. The Crack-up Boom Series Part VI Introduction
2. Smoke Signals, aka The “BIG” Picture
3. Years Ending in 7 and What Comes After! Nice, Very Nice.
Foreword - For greater insight into our publication, have a look at the Overview of Tedbits . It helps current and potential subscribers understand our mission in serving you. It also gives a broad description of what's unfolding globally and what you can expect from Tedbits as a regular reader.
1. The Crack Up Boom series is exploring the unfolding “Indirect Exchange” (as detailed by Ludvig Von Mises), that dollar holders will be using to exit their holdings now and eventually is will be followed by all holders of fiat currency holdings no matter which country is perpetrating the “fraud” of confiscation of wealth through the printing and credit creation process that all such monetary schemes evolve into. The “Crack Up Boom” will drive an inflationary global expansion to inconceivable heights over the coming years. Asset prices will skyrocket as people do what they always do when threatened they will modify their behavior and do the things necessary for “SELF PRESERVATION” of their families, countries, economies and their wealth. Let's take a look at Von Mises description of the CRACK UP BOOM once again:
This first stage of the inflationary process may last for many years. While it lasts, the prices of many goods and services are not yet adjusted to the altered money relation. There are still people in the country who have not yet become aware of the fact that they are confronted with a price revolution which will finally result in a considerable rise of all prices, although the extent of this rise will not be the same in the various commodities and services. These people still believe that prices one day will drop. Waiting for this day, they restrict their purchases and concomitantly increase their cash holdings. As long as such ideas are still held by public opinion, it is not yet too late for the government to abandon its inflationary policy.
But then finally the masses wake up. They become suddenly aware of the fact that inflation is a deliberate policy and will go on endlessly. A breakdown occurs. The crack-up boom appears. Everybody is anxious to swap his money against "real" goods, no matter whether he needs them or not, no matter how much money he has to pay for them. Within a very short time, within a few weeks or even days, the things which were used as money are no longer used as media of exchange. They become scrap paper. Nobody wants to give away anything against them.
It was this that happened with the Continental currency in America in 1781, with the French mandats territoriaux in 1796, and with the German mark in 1923. It will happen again whenever the same conditions appear. If a thing has to be used as a medium of exchange, public opinion must not believe that the quantity of this thing will increase beyond all bounds. Inflation is a policy that cannot last. Thank you Ludvig.
Unfortunately, for us all this is now NOT an isolated currency policy as detailed in the last paragraph, as globally virtually “ALL” governments are pursuing this policy at this point. So first we will see the biggest offenders suffer from their hubris AKA the “UNITED STATES” then it will rotate to all countries who follow such monetary policies. Public Servants always and every time have become Public Serpents robbing their constituents to further their personal ambitions and collection of power and wealth.
2. Smoke Signals, aka The “BIG” Picture
In the opening Crack up boom series we outlined the chorus of opinions expressed by the charts of global stock markets ( www.TraderView.com ) . And what a chorus it was, you just can't ignore what those charts are saying. And to think that with the exception of China the broad public is skeptical and on the sidelines is to realize how far these markets have to run. Today's “CRACK UP BOOM” is a lesson in TEA LEAF reading! They too are forming a chorus of INVESTMENT insights. ( www.TraderView.com )
Last week we outlined how the “POLICY OF INFLATION” through fiat money and credit creation is now “Globally” wide spread. Having learned their craft from the maestro Alan Greenscam er Greenspan, and now Ben Bernanke these Ce ntral banks and financial authorities are taking it to heights even they never imagined. In 1987 when the US stock market crashed the Greenspan “PUT” was born. This policy of meeting every financial or economic shock with the printing presses at the treasury commenced at that time, evolving into the greatest “BULL” market in history, stocks, bonds, real estate, etc. NOTHING WAS LEFT BEHIND.
The stock market crash of 1987, the real estate crunch in the late 1980's and early nineties, the emerging market bond market collapse of 1997-98, Y2K, NASDAQ and stock market weakness in 2001-2003, was met ALWAYS with the same prescription from the DOCTOR aka Greenspan. Print and lend away, today's real-estate problems, I promise you will be met with more of the same. The Federal Reserve and US treasury are on the prowl, checkbook in hand ready to drop money into the holes as the blasts from this latest “PROBLEM” emerge. Not to do so spell CURTAINS for the “asset backed” financial system as it is currently comprised. Bernanke is an EXPERT on the depression; a liquidity crisis will not be tolerated by this man, on that you can INVEST.
Of course public servants in the United States were staunch supporters of the Maestro, as his monetary policies made for soft recessions and heightened prospects for extending their incumbencies past the next election. Now Public Servants and financial authority's world wide have embraced his lessons. So the “CRACK UP BOOM” is now a GLOBAL AFFAIR. The rope is short in the United States, but not close to the end as most people think as most of the liabilities are held “OFF THE BOOKS”, and the mainstream financial media focus only on those that are “ON THE BOOKS” so the uniformed investor and public at large are sleeping just fine thinking things are “MANAGEABLE”. The only problems they are having are when they go to the grocery store, gas station, public utility, tuition window, etc. They haven't figured it out yet what the game now is.
But many others such as readers of this commentary and the “SMART MONEY” have. And the party has just begun, as I am about to outline to you. The first leg of this boom was from 1987 stock market lows to the 2000 highs (powered by Greenspan), we now have gone through a corrective period in time and price and the next leg is just beginning. The wind was at their backs as disinflation allowed them to get away with murdering the dollar through printing press with impunity. Dollars in circulation rose by some estimates 600% over the period of Alan Greenspans tenure at the Federal Reserve. This next leg up is powered not only by the United States money and credit creation machine but now by the Worlds Ce ntral Banks and Public Servants, as they build their own economies using Greenspans Blueprints . So get ready to party like its 1999!!! LOL.
Let's keep in mind the 10's of trillions of dollars, yen, Euros, Rupees, rubles, Swiss Francs, Aussie dollars, Di rhams, Real's, Yuan, that are just sitting in bank accounts and bonds around the world. It is what many store their wealth in and it is under “ASSAULT” as the governments that issue them try to steal the purchasing power in them while they sit in the bank and bonds from the people who hold them through “FIAT CURRENCY and CREDIT CREATION”. This money is being eaten daily by the governments as it sits in the banks and the bonds. Remember as well that what you will be looking at is priced in this BALONEY aka the currencies you use to conduct your affairs. This money must find a new home before this “CRACK UP BOOM” has run its course. I will be outlining many if its new homes and highlighting some of its past ones. Buckle up your seat belt!
WILSHIRE 5000
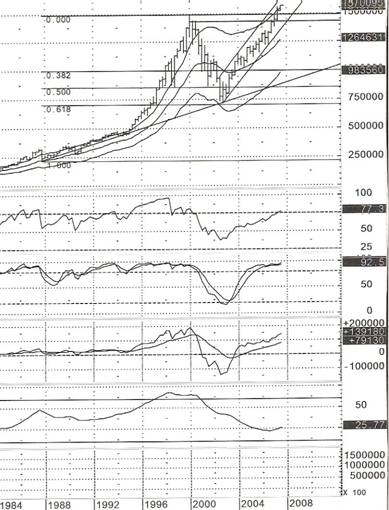 Lets take a look at numerous “Sectors” are saying in chorus. I want you to understand that price CHARTS of all markets contain all of the fundamental news you see or read. Millions of investors worldwide read the fundamental information and then place their money down in whatever market you are viewing. The price it closes at reflects all the information that the market participants know. The longer the time frame the more powerful the message and the investment implications for the longest periods going forward so we are GOING MACRO today to gather the information needed to make longer term investing conclusions. I urge you to review the archives for part I of the crack up boom series at www.TraderView.com , as other than the Wiltshire 5000 the other stock indexes of the world are covered there. Let's look at the Wiltshire 5000 , an index of virtually all US stocks.
This is as pretty a picture as you can imagine, it shows an 18 year bull market starting in 1982, a perfect Fibonacci 61.8% correction in time and price and a breakout signaling the next leg up in the ONGOING bull market. All the action since the 2000 peak now becomes a corrective pattern. The ADX trend gauge has reset to 25 (at 30 the new trend can be called firmly in place), and as it is low you should look for patterns, the pattern here is a reverse head and shoulders bottom, and rectangle box. MACD has HUGE momentum and shows NO SIGN of weakness, a pullback to the moving average is a buying opportunity, notice the years ending in 7 pullbacks as they are important to the next Tedbit, those episodes look to be repeated NOW. RSI is relentlessly trending higher and Slow stochastic's are looking like they are about to MIMIC the 1996 to 2000 period, which I believe they will. This is BULL market action and looks set to continue in the unfolding inflationary boom period we are now entering. But is nothing but bullish, tops are not made this way on charts
The next chart is of CITI Group, as everyone is worried about the CDO and CMO debacles unfolding as we speak, JP MORGANS chart is a clone of this. If these banks were going to fail or have longer term problems it would be seen in these charts. If it does crater from here look for it to fall no further than the longer term trend line just below forty. Notice the last two times CITI corrected enormously 2000-2002, then “1997”(keep in mind years ending in 7), But in the big picture this is nothing more than a chart of a BULL market in this MONEY CENTER bank.
CITI Group
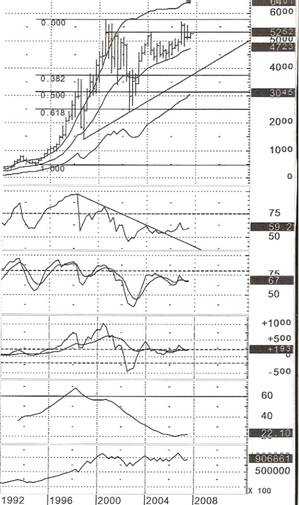 The Wiltshire 2000 is knocking on all time closing highs. The declining peaks in RSI have been broken and has reset to 59.2 leaving lots of room to run up. Perfect Fibonacci retracements in time and price and touching the long-term trendline. Volatility as measured by MACD is coiled like a spring (low volatility is followed by high volatility just as night follows day). It is knocking at ALL TIME highs. ADX is low and the reverse head and shoulders are easily seen, as is the cup and saucer over the last year. ON balance volume is turning UP. The sub prime debacle unfolding now will probably be an excellent long term BUYING opportunity once it is fully priced in. This is a bank that is TO BIG TO FAIL as is JP MORGAN/CHASE, as if they did it would imply the demise of NEW YORK as one of the financial capitals of the world. We will break to new highs, but probably not before a violent pullback soon. But is nothing but bullish, tops are not made this way on charts.
COPPER
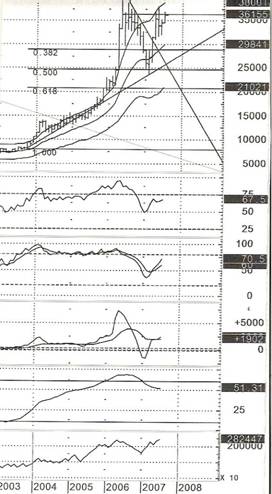 Now let's look at Doctor COPPER, a proxy for the world economy which is BOOMING. As 3 billion people are on the bid as they emerge in the BRIC's ( Brazil , Russia , India , and China ) and have to modernize their economies. This chart is a direct reflection of Globalization, as are the first two for that matter. This is not a top.
A perfect 50% Fibonacci retracements in time and price from the breakout from the lows under 79 cents. Slow Stochastic's are solidly higher after going through the 50% correction. It is poised just like CITI groups chart to move to NEW HIGHS. The first leg of this bull market gained over 3 dollars and 20 cents; you can expect this leg to as well. The emerging world is sitting on a cash hoard of over 4 trillion dollars, the build out has just begun.
Now lets look at gold, that monetary metal that confounds so many as it represents Man in the form of central banks money printing schemes versus Nature, as gold is MONEY since man emerged from the caves. I have inserted a line through the highs and it represents the all time closing monthly high of 671 back in 1980.
GOLD
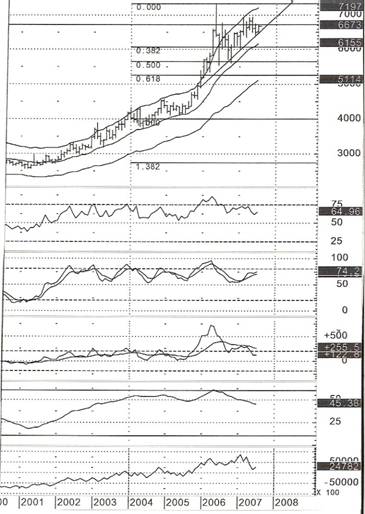 Knock, knock, knocking on heavens door for the gold bugs among us. Everything has reset, RSI has retreated from over 86 at last year May peak to 65 now. Stochastic's are headed firmly higher; MACD has retreated, corrected and is turning up. ON balance volume has retreated to the level of the last real breakout in October/November 2005 when gold was really just lifting off from breaking through the 400 dollar barrier. This market has completely worked off its overbought conditions that were generated on the run from 400 to over 700. A 14 month base has built up at the 1980 highs, consolidating and knocking on the door of a breakout, this is how markets consolidate before breaking to new highs. Finish through those highs we are knocking on and you better be long, and don't forget to buckle the old seat belts.
Let's take a peek at crude oil as a proxy for the energy markets; it's been reconfigured since two weeks ago as those prophesies have materialized and now this chart is about to issue another prediction, and what a prediction it is. The closing monthly high in crude since it last rose above twenty is $74.40, we closed at $73.93 last Friday. If we close above that price at the end of July or August this pattern projects crude prices to $98.90!! What do you think the energy sector of the stock markets will do on this kind of move, can you say higher? Let's go to the chart:
WTI CRUDE OIL
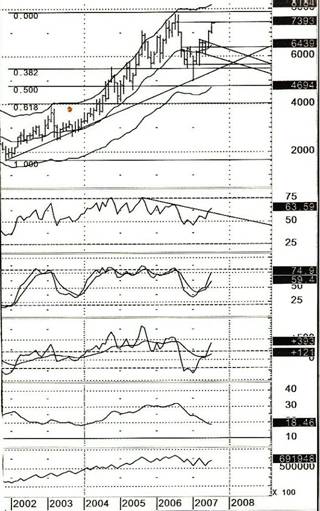 This is truly a pretty picture, perfect Fibonacci retracements in price from the lows under $20 dollars. If you look at a quarterly chart (not shown) it is a perfect Fibonacci retracements in time and price from the breakouts at 30 dollars a barrel. RSI has declined to 50 in bull market fashion and the downtrend in declining peaks has been broken, MACD and stochastic's are on BUY signals! and On balance volume has turned up after washing out the weak longs. ADX has reset and the patterns are CLEAR, a close above $74.40 activates a projection to almost $100 dollars!!! Recent action has also gone into backwardization, indicating supply tightness ahead, oil doesn't go into backwardization at TOPS!
Now let's look at the broad basket of commodities as represented by the CRB index basket of commodities, and it is more bullish than anything we have looked at, as there basically are NO pullbacks. Let go to the charts:
CRB COMMODITY INDEX
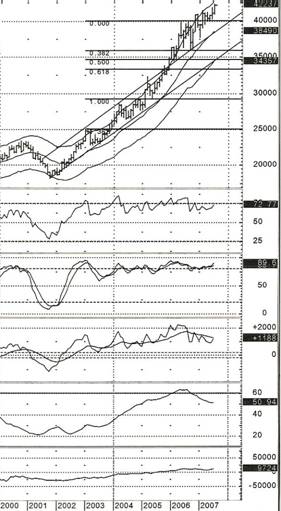
Look at the tight channel since 2001, which it broke out to the upside of in 2005 signaling acceleration in the trend higher. It then worked its way sideways and tested the increased angle of ascent and did a 38% Fibonacci retracements in time and price, the RSI has broken through the declining peaks stochastic's are on a buy signal and MACD is issuing a buy signal as we speak. It has just risen to NEW HIGHS! ADX has receded so the trend can resume and On balance volume barely budged to the downside. THIS IS A MONTHLY CHART and very powerful, arguably the most powerful we have viewed as it represents 3 Billion people in the BRIC's on the bid. The commodity bull market is alive and well thank you!!
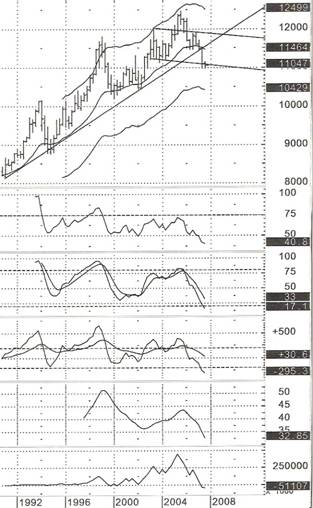
Now its time to look at the reflections of these markets and they are represented by the Bomb, er Bond markets around the world and of course everybody's favorite crash watch the dollar index. The first charts we will look at are the largest bond markets in the world as represented by quarterly charts of 10 year Bunds ( Germany ), 10 year notes (US), and Gilts (UK). Let's go to the charts:
US 10-YEAR NOTES : GERMAN 10-YEAR BUNDS
UK 10-YEAR GILTS
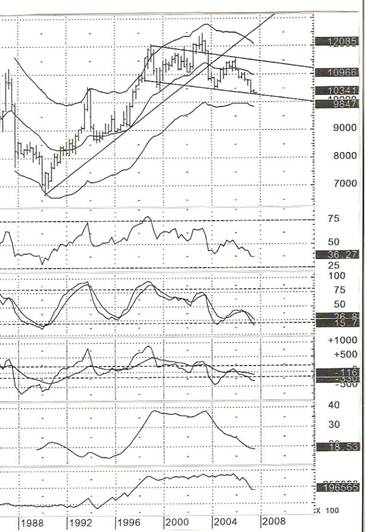 All three made their final highs in 2003 or 2004, all have broken their trendline from the bear market lows of the early 1980's, rallied after the initial break downs and FAILED to reenter the multi decade SECULAR bull markets they had just completed. Now they have entered the opposite a SECULAR BEAR market, RSI has failed to stop at 50 and entered BEAR market territory below 50, Stochastic's and MACD are a chorus singing BOMBS er, BOND's away. Head and shoulder TOPS are easily seen in the gilts and bunds. They are oversold so you can expect a rally which would correspond with the years ending in 7 scenario of a lower stock market into the fall (see next Tedbit). Then weakness can be expected to RESUME in the INFLATIONARY “CRACK UP BOOM”. Stay out of bonds that aren't short term in nature and which you plan to hold till maturity, it really is that simple, the capital risk is ENORMOUS. Because the fiat money and credit creation will never end for as far as the eye can see. 20 years up in bonds now becomes 20 years DOWN!
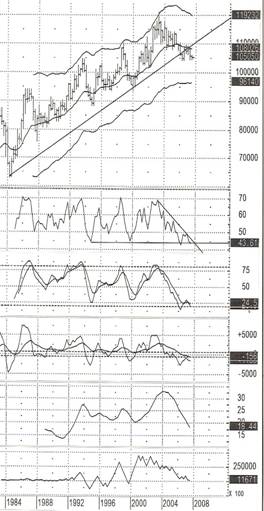
Now lets look at the quarterly chart of the dollar index, pushing on twenty year lows, this is the only market in the world were BOTH the longs and the shorts don't want it to go lower!! The longs represented by anyone who holds a dollar or a dollar denominated bond, the shorts represented by the US government whose plans for infinite printing of them can be thrown awry. Let's look at the chart:
QUARTERLY DOLLAR INDEX
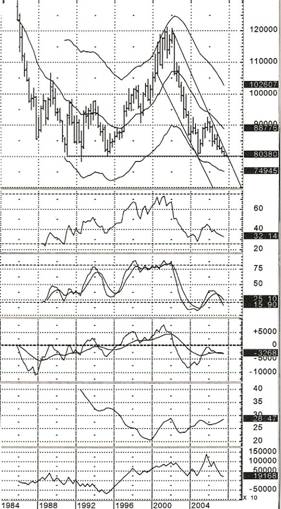 This is about as UGLY as you can get, the US congress wants a lower dollar and you better be careful what you wish for as you might get it good and hard, and they are about to get their wish. ADX is in trend mode and approaching the solid level of 30, MACD is on a sell signal and stochastic's are pointing firmly lower, RSI is diverging on price, so look for a minor rally maybe before the trend resumes. The bottom of the trend channel as outlined is a 25% loss from its current level, are you ready for that Senators Schumer, Graham, Grassley, Baucus and Ms. Clinton etc. It is INFLATION written large for the US consumer as NOTHING is made in the USA anymore, and the energy crisis is about to get a whole lot worse. When that kind of dive in the value of the dollar MATERIALIZES it is self fulfilling prophesies of $100 dollar crude oil, and 1000 dollar gold. Things are about to get really really hot for our PUBLIC SERVANTS. They need look no further than the MIRROR for its genesis.
What do these charts scream in unison? “CRACK UP BOOM” as they are where dollars are headed to in the “INDIRECT EXCHANGE” in their quest to preserve their value. They are going to be spent on anything that can't be printed, who cares what the value of what you buy is as long as it can't be printed! Stocks and commodities just reprice to reflect the lower purchasing power. Dollars and bonds represent just the opposite as they are the fertile ground the government printing and credit creation targets for theft. So its time to GET OUT. It's going to be interesting times with lots of Great investment OPPORTUNITIES.
3. Years' ending in 7 and what comes after!
It doesn't matter which global stock market you view, they are all in unison signaling the inflationary global boom as outlined by VON MISE'S in the crack up boom. But they are now a “FINGER OF INSTABILITY”(see Tedbits archives at www.TraderView.com )
As they have gotten ahead of themselves as excellent fundamentals have combined with too much liquidity to go TOO FAR, TOO FAST. Last week Federal Reserve chairman Bernanke made to statements which are INTERESTING. The first being that inflation expectations are “IMPERFECTLY ANCHORED” and that a “fiscal” crisis now threatens the near future and of course he speaks of the CDO, CMO (collateralized debt/mortgage obligations) crisis that is disrupting the credit markets.
What a perfect one two punch to people who may now be a little overconfident. It is being reported that between 200 and 600 BILLION dollars worth of these toxic BOMBS sit on the balance sheets of institutions and pension funds. Sounds like a lot, but it is barely 3 or 4 months of money printing at the current pace, and as I have previously mentioned, they have the checkbooks at the ready. They will print the money BEFORE it destroys the liquidity of the US financial system, on that you can rely. Only the LITTLE guy will be left out of the rescue, and he or she will be Hung/left out to DRY. It has been over 1500 days since the US markets have corrected over 10%, the longest stretch in HISTORY. So we are due.
I want you now to look at two charts of EXCELLENT WORK by Peter Eliades of www.Stockmarketcycles.com (I highly recommend his excellent analysis). The first chart is the years ending in 7 with each day averaged over a hundred year timeframe spanning 1897 to 1997, and of course we are in 2007. Take a look at this; it is breathtaking in its correlation:
He published this chart a week ago and look what happened the vertical spike we saw this past week in the global markets MIRRORED the pattern going forward as outlined. We now have a “ROADMAP” on what to watch for and when. If Bernanke has to pull out his checkbook to address the emerging CDO/CMO “FINGER OF INSTABILITY” (see archives at www.TraderView.com ) and the stock market corrects which it badly needs to do it will set the table for the next round of fiat currency and credit creation.
Bernanke's big job will be to take the bombs off the balance sheets of the institutions and pension funds as they are actually “WEAK HANDS” as their investment covenants force them to sell if the investments they hold fall below a certain investment grade rating. Which they are doing on a daily basis. These institutions and pension funds (incompetent fools) seldom if ever look past the S&P, MOODY”S or Fitch rating label, and the Oak-lined offices of the money center banks and prime brokerages. As once those are applied to ANY investment product the only consideration is the track record, and up until now they have been EXCELLENT, as marking to model has been different than marking to market as up until now there hasn't been a market for these securities except over the counter. So you can expect the years ending in 7 to do what they have done for over a hundred years, and that is “CRATER”.
In Peter's daily update of July 16 he notices something very rare:
“Something happened today that has never happened before in the history of the Dow, at least in the 81 year history we were able to check in our computer database. The Dow Jones Industrial Average closed at a new all-time high while breadth on the New York Stock Exchange was greater than 2-1 on the negative side. This is not phony, distorted breadth either, because the breadth on the S&P 500 was also almost at a 2-1 negative ratio with 166 up issues and 328 declining issues. That has never happened before going back to 1926. Of course, if something has never happened before, it is difficult to attribute significance to it if it happens for the first time.”
Wow, very interesting, as anyone who has tried to short this market has been severely punished by the marketplace. A LOT of last week's 280 point rally was a short covering BONFIRE of the record short interest in stocks. Big funds and the Plunge protection team took the shorts to the BANK! Punishing them for the heresy of selling things short in an asset backed “Financial system”. Puts are at record levels so it will be very hard for the market to retreat on such negative sentiment.
Another catalyst for this pullback is Murphy's law, what can go wrong will go wrong. The big banks are out on a limb, they have committed to 10's of billions of private equity financing with cov lite terms and the Junk bond markets have seized up in fear of the sub prime mess and because of the sell off in the bond markets in general, leaving them holding the bag on commitments they had planned on unloading on investors. They are long those loan obligations and very nervous!
And of course it is a big opportunity for those of us that use sophisticated techniques such as “SHORTING” the market. LOL. (If you want to learn how to capture opportunities in UP or down markets contact me at www.Traderview.com ). Should we worry and pull the covers tight over our heads, probably no as look at the next chart covering the same time-frame. It is extended to the other side of the outlined pattern going out over the same time period but going into years ending in 8:
The “CRACK UP BOOM” saves the day as dollar holders EVERYWHERE step forward to take advantage of the “Indirect Exchange” opportunity courtesy of the “FIRE” sale on stocks. LOL. Nothing is a sure thing, if this pattern does not unfold as outlined it is solid evidence of the crack up boom in full swing. So buckle up your seat belts and get ready for a roller coaster ride into the fall.
A fall like the one outlined above would only be healthy and take the worlds stock markets back to their 20 month bull market moving averages, in the case of the Dow Jones industrials it is 12,220, on the quarterly chart it is 11,190. In the case of the S&P 500 the monthly moving average is 1387, and the quarterly moving average is 1272. I WILL SAY IT WITH MORE EMPHASIS - THIS WOULD BE A HEALTHY EVENT!
Of course it would “RE” anchor the publics inflation expectations as Bernanke desires, and would entail the short term fiscal crisis he warns about. But until it happens he can't see where the fires are so he can send his helicopters with water er cash to put them out! So it's off to the races for the next month or so, then a breathtaking ride on the rollercoaster named stocks. It will be interesting to see if history repeats itself AGAIN!
In conclusion, an inflationary BOOM is on the near horizon courtesy of the emerging “CRACK UP BOOM”, and it has many years to run. As Ludvig says about the crack up boom “ This first stage of the inflationary process may last for many years”, and it will. “FINGERS OF INSTABILITY” (see Tedbits archives at www.TraderView.com ) will present themselves over and over again in reoccurring patterns. Learn to benefit from them, don't let them knock you out of your longer term opportunities. (if you wish to do tackle these downswings and turn them into opportunities contact me at www.Traderview.com ). The gas of Trillions of dollars and other currencies are sitting in the tank (er BANK), so to speak ready to fuel the “CRACK UP BOOM”. Those that look for deflation you are WAY early, but your faith in it shall be renewed if the stock market holds to history. Thank you for reading Tedbits, if you enjoyed it send it to a friend or subscribe its free at www.traderview.com . Don't miss the next and final edition of the “CRACK UP BOOM” series!
If you enjoyed this edition of Tedbits then subscribe – it's free , and we ask you to send it to a friend and visit our archives for additional insights from previous editions, lively thoughts, and our guest commentaries. Tedbits is a weekly publication that comes out on Thursdays or Fridays.
By Ty Andros
TraderView
Copyright © 2007 Ty Andros
Tedbits is authored by Theodore "Ty" Andros , and is registered with TraderView, a registered CTA (Commodity Trading Advisor) and Global Asset Advisors (Introducing Broker). TraderView is a managed futures and alternative investment boutique. Mr. Andros began his commodity career in the early 1980's and became a managed futures specialist beginning in 1985. Mr. Andros duties include marketing, sales, and portfolio selection and monitoring, customer relations and all aspects required in building a successful managed futures and alternative investment brokerage service. Mr. Andros attended the University of San Di ego , and the University of Miami , majoring in Marketing, Economics and Business Administration. He began his career as a broker in 1983, and has worked his way to the creation of TraderView. Mr. Andros is active in Economic analysis and brings this information and analysis to his clients on a regular basis, creating investment portfolios designed to capture these unfolding opportunities as the emerge. Ty prides himself on his personal preparation for the markets as they unfold and his ability to take this information and build professionally managed portfolios. Developing a loyal clientele.
Disclaimer - This report may include information obtained from sources believed to be reliable and accurate as of the date of this publication, but no independent verification has been made to ensure its accuracy or completeness. Opinions expressed are subject to change without notice. This report is not a request to engage in any transaction involving the purchase or sale of futures contracts or options on futures. There is a substantial risk of loss associated with trading futures, foreign exchange, and options on futures. This letter is not intended as investment advice, and its use in any respect is entirely the responsibility of the user. Past performance is never a guarantee of future results.
Ty Andros Archive |
© 2005-2022 http://www.MarketOracle.co.uk - The Market Oracle is a FREE Daily Financial Markets Analysis & Forecasting online publication.