


U.S. Treasury Bonds Interest Rate Yield Curve Steepest Since 1980
Interest-Rates / US Bonds Dec 11, 2009 - 02:42 AM GMTBy: Mike_Shedlock

 The bond market is starting to show signs of concern over budget deficits and the corresponding supply of treasuries. Please consider Treasury Yield Curve Steepest Since at Least 1980 After Auction.
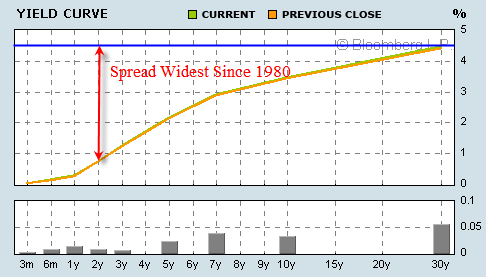
Treasuries fell, with the gap in yields between 2- and 30-year securities reaching the widest margin since at least 1980, after a $13 billion offering of 30- year bonds drew lower-than-forecast demand.
The so-called yield curve touched 372 basis points, the most in at least 29 years, as the bonds drew a yield of 4.52 percent. The so-called yield curve has widened from 191 basis points at the end of 2008, with the Fed anchoring its target rate at a record-low range of zero to 0.25 percent and the Treasury extending the average maturity of U.S. debt.
Treasury officials on Nov. 4 announced a long-term target of six to seven years for the average maturity of Treasury debt and said the department wants to cut back on its issuance of bills and two- and three-year notes. The shift to longer- maturity debt has raised concern that investors will demand higher yields to offset the risk of inflation as government spending drives the deficit to a record $1.4 trillion.
“The market is continuing to worry about the massive amount of Treasury issuance that’s going to hit the market well into next year,” said Ian Lyngen, senior government bond strategist at CRT Capital Group LLC in Stamford, Connecticut. “In the very short term, part of it is going to be supply accommodation.”
Yield Curve As Of December 10 2009
Historical Yield Curve
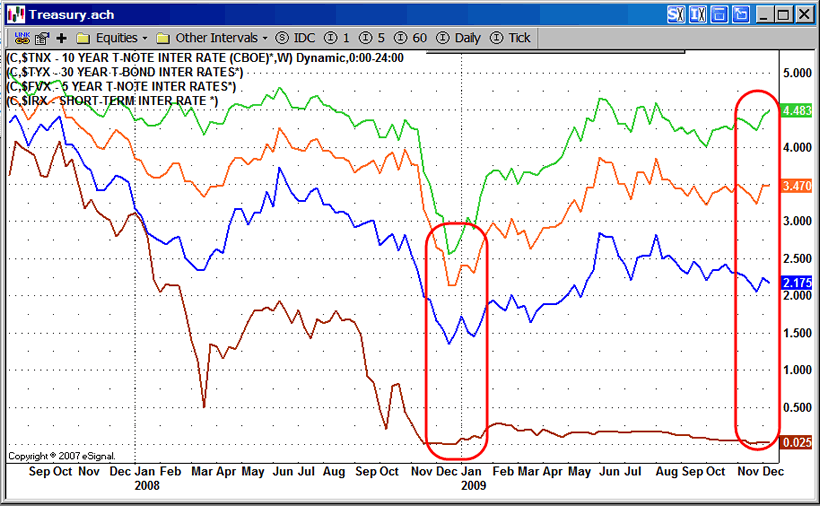
Chart Symbols
$IRX - The 3 month treasury - Brown
$FVX - The 5 year treasury - Blue
$TNX - The 10 year treasury - Orange
$TYX - The 30 year treasury - Green
A 2 year treasury symbol is not available.
The above chart shows the dramatic steepening in the yield curve since January 2009. This steepening is reflective of several things: An economy presumed to be improving but not at a very good rate, the Fed holding down short-term rates, and the huge pending supply of treasuries to finance the budget.
Judging from action in the 5-year treasury, it appears as if there is a long 3-to-5 year, short 30-year trade in play.
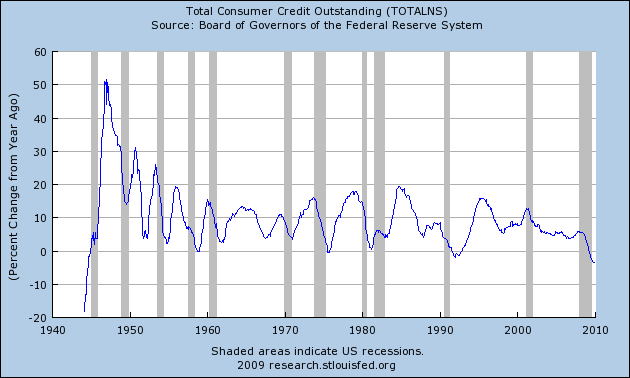
Even with that steep yield curve, banks are not lending judging by the plunge in consumer credit and small business loans.
Total Consumer Credit
Total Bank Credit
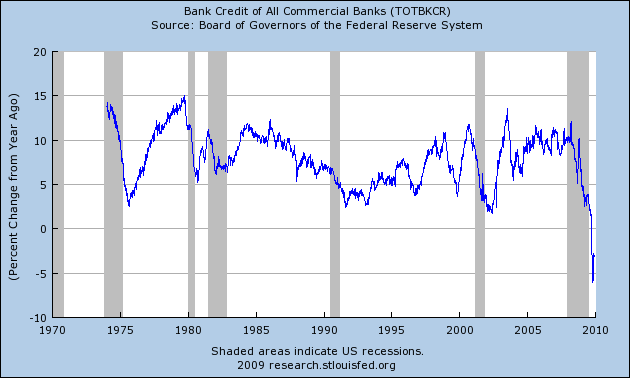
Total bank credit is starting to rebound but from depths never before seen.
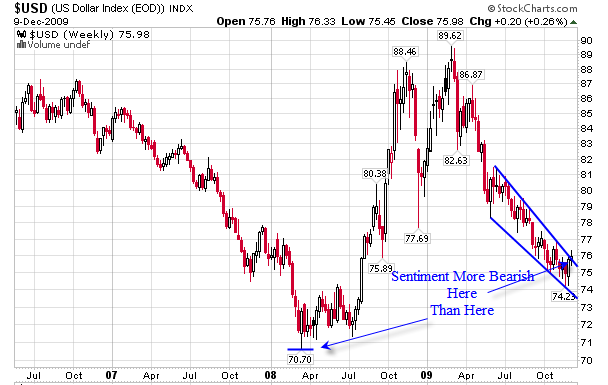
US$ Weekly Chart
2010 Forecast - The Great Retrace
That segment with Aaron Task is from Mish: Nov. Jobs Report "Looked Fabricated", Expect Harder Times in 2010
By Mike "Mish" ShedlockFrom President Obama on down, Americans are hoping Friday's stronger-than-expected November jobs report marked the beginning of the end of our national unemployment nightmare. Looking beyond the November jobs data, Shedlock says the odds of the unemployment rate coming down anytime soon are remote.
As confident as he is about the grim outlook for jobs, Shedlock was very reticent to make market predictions in the accompanying video, taped Friday evening at Minyanville's annual Holiday Festivus in New York City.
In a subsequent email, Shedlock was more willing to take a position, as is more typical of the opinionated blogger:
"In the absence of a war outbreak in the Middle East or Pakistan -- and/or Congress going completely insane with more stimulus efforts -- I think oil prices are likely to drop, the dollar will strengthen or at least hold its own, and the best opportunities are likely to be on the short side," he writes. "2010 is highly likely to retrace most if not all of the ‘reflation' efforts of 2009. If things play out as I suspect, 2010 will be the year of the great retrace as the economic recovery disappoints."If the US$ breaks North in a sustained way as it appears poised to do, and if treasury yields break higher as well (on that I have no firm opinion), 2010 is going to be one miserable year for nearly everyone.
Note that a seasonal favorable period for treasuries ends this month. Moreover, March-May is typically the worst period for government bonds because of budgeting and tax refunds. However, one should not lightly dismiss the possibility of another flight to safety play if commodities and equities head dramatically lower as I ultimately expect them to do.
http://globaleconomicanalysis.blogspot.com Click Here To Scroll Thru My Recent Post List
Mike Shedlock / Mish is a registered investment advisor representative for SitkaPacific Capital Management . Sitka Pacific is an asset management firm whose goal is strong performance and low volatility, regardless of market direction.
Visit Sitka Pacific's Account Management Page to learn more about wealth management and capital preservation strategies of Sitka Pacific.
I do weekly podcasts every Thursday on HoweStreet and a brief 7 minute segment on Saturday on CKNW AM 980 in Vancouver.
When not writing about stocks or the economy I spends a great deal of time on photography and in the garden. I have over 80 magazine and book cover credits. Some of my Wisconsin and gardening images can be seen at MichaelShedlock.com .
© 2009 Mike Shedlock, All Rights Reserved
Mike Shedlock Archive |
© 2005-2022 http://www.MarketOracle.co.uk - The Market Oracle is a FREE Daily Financial Markets Analysis & Forecasting online publication.
Comments
|
tps
11 Dec 09, 15:07 |
Playing the Yield Gap
might be of interest: Playing the Yield Gap http://seekingalpha.com/article/177840-playing-the-yield-gap |