Economic Contraction will Continue in 2010
Economics / Recession 2008 - 2010 Dec 15, 2009 - 05:47 AM GMTBy: Brian_Bloom

 My wife and I watched Oprah interviewing President and Mrs. Obama for her Christmas Special. The closing message that President Obama tried to communicate was one of hope – that the worst is behind us and, with hard work and determination, America can rebuild.
Whilst the sentiments are admirable and probably believable in terms of America’s ability to rebuild – and possibly even true – there are serious questions regarding whether the worst is behind us.
Below is a weekly bar chart of the 30 year bond yield in the US (courtesy Bigcharts.com). The yield may be thought of as the “price” that the market requires the US Government to pay if it wants to borrow money by issuing long dated Treasury Bonds.
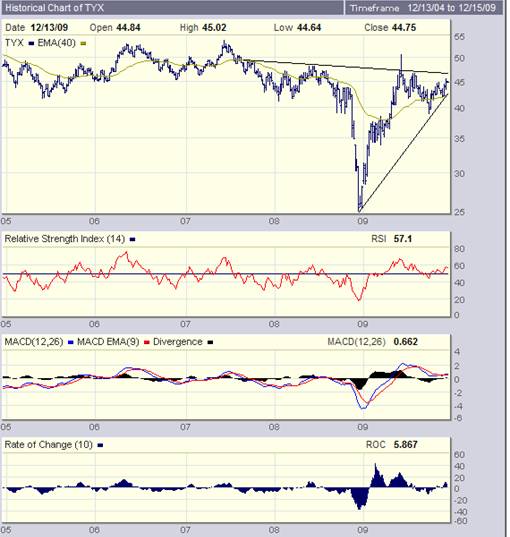
Right now, the price of 30 year money is 4.475% and the yield is above its rising 40 week Moving Average.
Let’s take a closer look at this weekly chart from a different perspective, courtesy Stockcharts.com
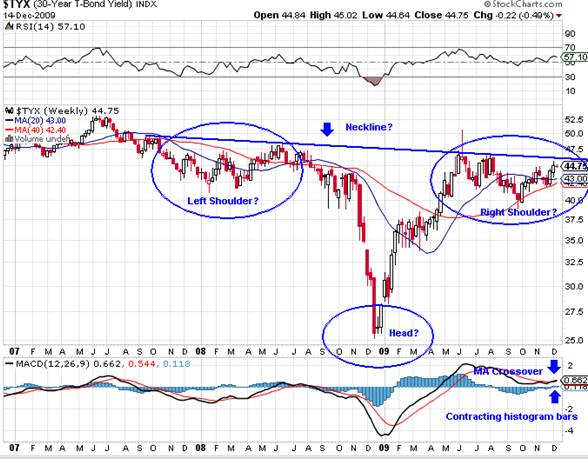
What we see above is the possible emergence of a Reverse Head and Shoulders Formation. The word “possible” is emphasized because, strictly speaking, we need volume to confirm the pattern.
However, on the assumption that this is a Reverse Head and Shoulders and on the assumption that the crossover on the Moving Averages of the MACD is a pointer to a coming break up of the yield itself through the neckline, then the reader should focus on the fact that the target destination of the 30 year yield will be (44.75-25.0)+44.75
= 6.45%.
If the US Public Debt is all long term (not true, but perhaps implying more serious issues regarding ability to roll over short term debts), then the interest burden on the US Debt will be calculated as follows:
$12.08 trillion (source: http://www.treasurydirect.gov/NP/NPGateway ) * 6.45%
= $779 billion p.a.
This number should be seen in context of the Central Budget Office’s projected budget deficit for 2009 of $1.2 trillion (source: http://money.cnn.com/2009/01/07/news/economy/cbo_2009_budget_outlook/index.htm )
In principle, by far the majority of the budget deficit is attributable to the interest burden on existing debt.
In this context, the following Point and Figure Chart of the Ten Year Yield is possibly also of some significance (also courtesy stockcharts.com)
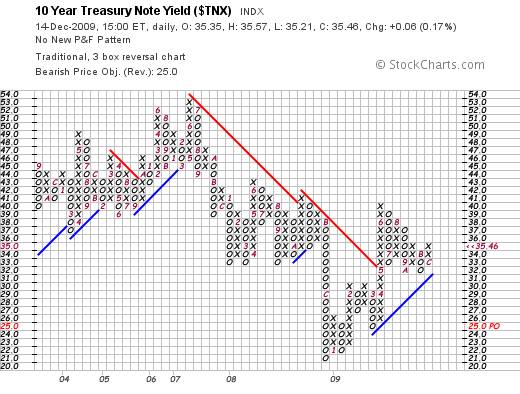
The reader will note that the 10 years yield is above its rising blue trend line and that any move to 3.6% or higher will constitute a buy signal (sell signal on Treasury Bond Price).
Is the worst behind us? Well, let’s think it through.
There is a concept in finance known as “Risk Weighted Return on Investment”. Everyone knows about this concept in principle, but let me articulate it here for the sake of clarity:
Return on investment is a function of risk. The higher the risk, the higher the return that will be demanded by investors.
Clearly, equities represent a higher relative risk proposition than AAA rated government bonds. Clearly, if the price of borrowing (yields on Treasuries) rises then the return on investment on equities must also rise.
But what constitutes a return on investment in the world of equities? Most people seem to have forgotten that it is a combination of capital gains and dividend yields and that capital values are a function of earnings multiplied by Price/Earnings Ratios. Yields on equities will also need to rise – implying that either earnings must rise or Price/Earnings ratios must fall.
Right now, dividend yields on the $SPX are around 2.2% (DJIA 26%) (Source: Decisionpoint.com)
As stated, Earnings yields are the flip side of Price/Earnings ratios; so let’s look at P/E ratios because the issues in this regard might be easier to communicate
In respect of Price/Earnings Ratios, the forecast GAAP adjusted P/E ratio for Q2 2010 is 19.7X.
Historically, 19.7X is typically seen at market peaks rather than at market bottoms, as can be seen from the chart below (Red Line). This implies that the market now has very little upside potential (if any) from a fundamental perspective.
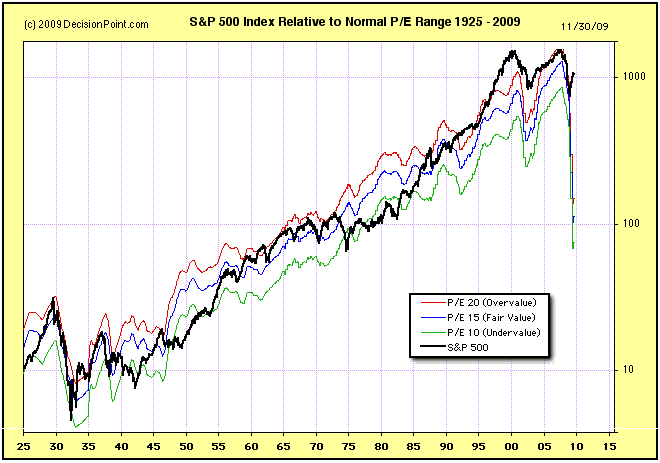
The steep fall being called for in the chart above (courtesy Decisionpoint.com) flows from the fact that the most recent (Q2 2009) GAAP adjusted P/E was 148.4X. i.e. It needs to be emphasized that the 19.7X number is a forecast number which, even if it materializes, will represent full value.
Conclusion
If yields on US Treasuries start to rise in earnest, risk weighted yields on equities will need to adjust upwards proportionately. The P/E ratios on the US stock market will likely shrink as a consequence, implying that equity prices will likely fall.
This begs the question: Is there any technical evidence that equity prices might fall?
The chart below, courtesy Bigcharts.com, has a very worrying formation:
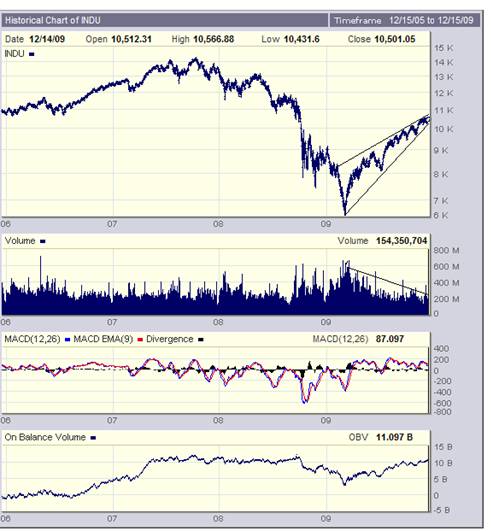
What it is showing is a “rising wedge” formation in context of a pattern of falling volumes.
In simple English, rising prices on falling volumes implies an absence of selling pressure as opposed to a presence of buying pressure. Further, the fact that the angle of incline of the lower trend line is more acute than that of the top trend line implies that buyer enthusiasm is being tempered by seller caution and that caution is prevailing.
Typically, if the lower trend line of a rising wedge is penetrated on the downside the price will – at least – retrace its steps all the way back to the level at which the rising wedge commenced – i.e. 6K.
Which brings us back to President Obama’s message of hope.
Of course, none of these signals has yet been given and he may be proven correct. But this analysts’ understanding of the world’s economic model and what drives the world economy does not allow for him to be correct.
In simple terms – as is clearly laid out in my recently published novel, Beyond Neanderthal – the world economy is driven by energy in general and by oil in particular.
The world has passed Peak Oil and the gabfest at Copenhagen has objectives which, if realized, will seriously undermine economic activity. If the world is to reduce CO2 emissions then the world’s reliance on fossil fuels will have to reduce. There is no room for discussion on this point. But, if there is insufficient momentum for clean energy technologies to fill the void thus created then world economic activity must contract.
Right now the most likely technology – the one that the politicians are lobbying for (and I will refrain from commenting here on the wisdom of this – it will be the subject of my next novel) – will be nuclear fission. Russia is apparently sitting on orders for around 30 nuclear power plants and is strategically positioning itself to dominate this market.
But, pragmatically, here’s the thing: In the USA, the woe-to-go planning/construction lifecycle of a nuclear power plant from conception to execution is around 10 years. Right now, to this analyst’s knowledge, only one new nuclear power plant has been approved (in Georgia) and, right now, there is nowhere to store the nuclear waste that will be created except in so-called swimming pools located adjacent to the nuclear plants. If nuclear turns out to be the energy technology of preference then there are still a large umber of boxes to be ticked before nuclear energy can become a practical reality in the USA.
So, whether or not President Obama is correct that the USA has the capacity to rebuild itself if its citizens apply their minds is not particular relevant. The more important question is whether he is correct in his statement that the worst is over. The answer to this question is probably “no”.
Overall Conclusion
If energy in fact drives the world economy and the world is to consciously reduce its dependence on fossil fuels for whatever reason - and there is as yet, no mature energy technology/ies which can facilitate a smooth transition – then there is no question that the worst is not yet over.
What needs to happen is that the financial excesses of the past 30-40 years have to work their way through the system. This idea of quantitative easing has been a nonsense in context of the fact that is has done nothing to facilitate a transition to new energy paradigms. If anything it has provided a short term boost and has exacerbated the longer term problems by creating an even bigger debt mountain.
The core issues – there are several - are all laid out in Beyond Neanderthal as is a potential road map regarding what we might do about these core issues. Unless and until these issues are addressed we can expect unemployment levels in the USA to continue to grow and we can expect international tensions to continue to rise.
The good news is that the core issues are addressable. It will be a matter of time. But in the meantime we should not harbor foolish expectations that our problems will disappear just because we wish it so.
The charts are all pointing to the culmination of the “final stages” of the technical upward reaction within a Primary Bear Market. There are no technical pointers to support the argument that the worst may be over. To the contrary, the evidence seems to suggest that the best of the bounce may be drawing to a close.
By Brian Bloom
Once in a while a book comes along that ‘nails’ the issues of our times. Brian Bloom has demonstrated an uncanny ability to predict world events, sometimes even before they are on the media radar. First he predicted the world financial crisis and its timing, then the increasing controversies regarding the causes of climate change. Next will be a dawning understanding that humanity must embrace radically new thought paradigms with regard to energy, or face extinction.
Via the medium of its lighthearted and entertaining storyline, Beyond Neanderthal highlights the common links between Christianity, Judaism, Islam, Hinduism and Taoism and draws attention to an alternative energy source known to the Ancients. How was this common knowledge lost? Have ego and testosterone befuddled our thought processes? The Muslim population is now approaching 1.6 billion across the planet. The clash of civilizations between Judeo-Christians and Muslims is heightening. Is there a peaceful way to diffuse this situation or will ego and testosterone get in the way of that too? Beyond Neanderthal makes the case for a possible way forward on both the energy and the clash of civilizations fronts.
Copies of Beyond Neanderthal may be ordered via www.beyondneanderthal.com or from Amazon
Copyright © 2009 Brian Bloom - All Rights Reserved
Disclaimer: The above is a matter of opinion provided for general information purposes only and is not intended as investment advice. Information and analysis above are derived from sources and utilising methods believed to be reliable, but we cannot accept responsibility for any losses you may incur as a result of this analysis. Individuals should consult with their personal financial advisors.
Brian Bloom Archive |
© 2005-2022 http://www.MarketOracle.co.uk - The Market Oracle is a FREE Daily Financial Markets Analysis & Forecasting online publication.


