Gold Correction Targeting and Inter-market Dynamics
Commodities / Gold & Silver 2009 Dec 15, 2009 - 11:55 AM GMT The following excerpt is a small sampling of this week’s full market wrap report, which covers all the major markets in detail, with the emphasis on gold and the precious metals. Before covering the pm sector, I’d like to discuss some inter-market dynamics that have contributed to the hot money flows recently affecting the markets.
Bonds
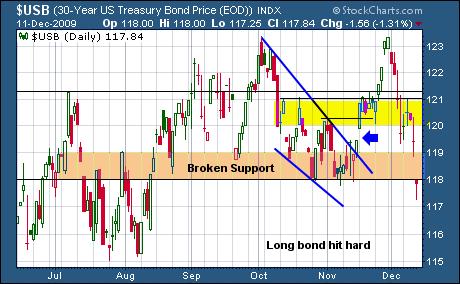
For the past few weeks this report has discussed that either bonds or stocks (or both) were lying, as both assets were moving higher together, and that one or the other would soon change direction. Well, bonds reversed direction this past week with an explosion of gaps to the downside.
What is particularly interesting is that the long end was hit the hardest, meaning that interest rates on the long bond went up the most, as interest rates and bond prices move in opposite directions. In turn the yield curve (difference between long & short term rates) continues to steepen.
The government sold a lot of debt this past week, and it has plenty more to issue to fund its largess, which is more than enough reasons (trillions) why bond holders are demanding more interest to compensate for the additional risk.
As the chart below shows, the 30 Year bond fell off a cliff: dropping from 123 to 117 since the beginning of the month. Price sliced through support level after support level. The open gap was filled in the blink of an eye and prices kept falling.
In the full market wrap report we show a chart of the 30 Year Yield going back three decades, and the implications the data suggests. The above information is sufficient for leading into the next topic: the dollar.
Currency
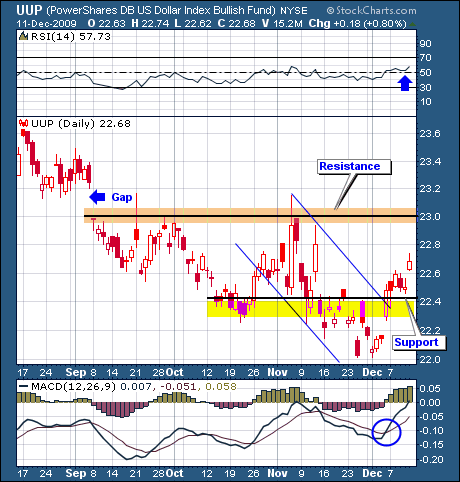
The dollar is attempting to rally. So far its advance has been slow and hard. There has yet to be any panic covering of short positions, which could provide some fireworks – if they were to occur.
Significant overhead resistance resides at 23, with an open gap just above. MACD has put in a positive crossover, and RSI has finally broken above the elusive 55 level. Support is at 22.4
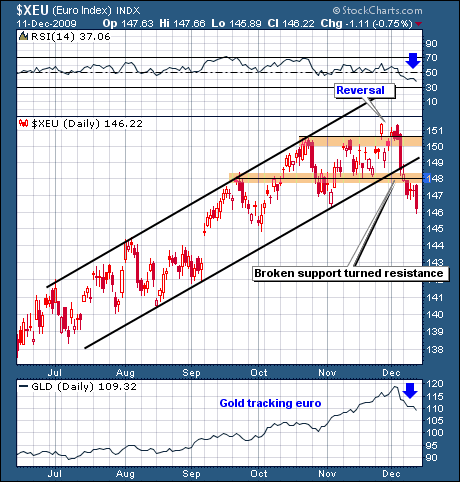
The chart of the euro is the opposite of the dollar. While the dollar has been falling relentlessly, the euro has been rising relentlessly. Now, the euro has broken below its rising channel and its Nov. low as well. Broken support has turned into resistance.
Notice at the bottom of the chart that gold turned down at the same exact time that the dollar moved up and the euro headed down.
Gold
Gold dropped $47.20, closing at $1115.20, for a weekly loss of just over 4%. Coupled with last week’s loss and gold is down about 8% from its record high.
Gold rose very fast and it has fallen accordingly. Parabolic moves are hard to sustain and a correction was overdue. Long term it is healthier. For regular readers it was of no surprise.
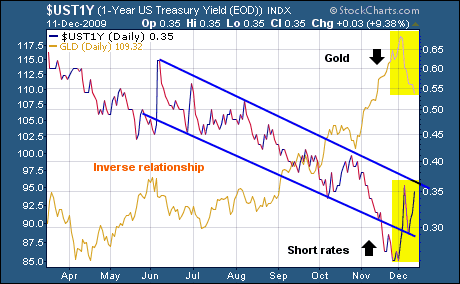
The dollar and gold move inversely (opposite) to one another. With the dollar’s recent rally – gold finally corrected.
Notice on the chart below the relationship between gold and one year treasury yields: they move in opposite directions. The dollar rallied because short term rates spiked up. Thus gold moved down.
Up next is the daily gold chart going back to the beginning of the year. Note the steepness of the ascent from 1075 and up: a parabolic rise with little intervening support.
Gold’s 50 dma is fast approaching. If it is broken below, the next level of support is marked by the yellow horizontal band around 1050-1075. Significant support is further below near 1000.
RSI has broken below the 50 level. Note that CCI has given pretty good sell signals when it moved from overbought (+200) to below 100, which is why we have been closely watching it the last few weeks.
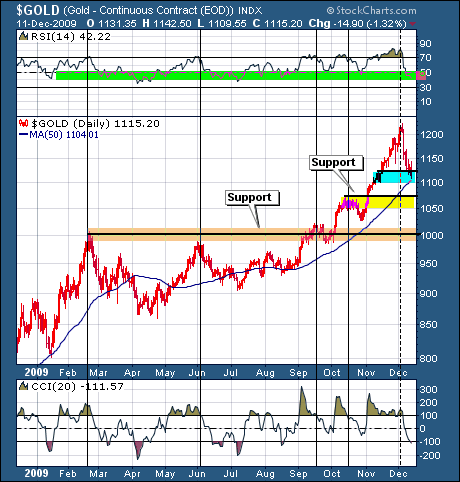
Since Dec. 2008, gold has gained approximately $400 dollars or 50% (800+400=1200). It is not unusual for an asset to correct a third to one half of its gain: 400/2=200 – 1200-200=1000. These numbers are just possibilities. Gold may never correct this much. Then again, it might.
Gold Stocks
Last week the GDX was only down about .25%, although on Friday of that week (12/4/09) it gaped down about 5%. GDX continued its decline this week, losing another 5.66%.
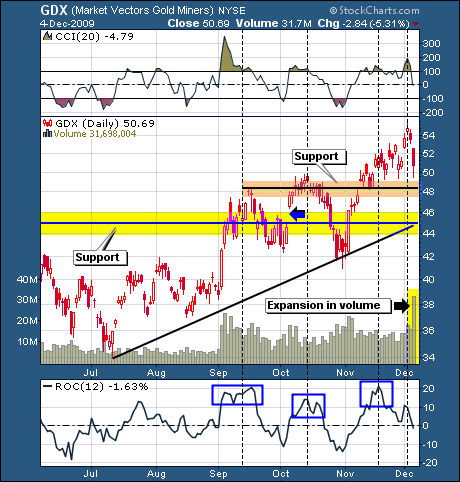
Since its closing high of 54.78 on Dec. 2, the GDX has lost about 12%. Price is presently testing support. If the gold stocks don’t hold here, the next target is the lower diagonal trend line near 46.
Once again, the CCI index gave a good sell signal, as mentioned in last week’s report: (following is from last week’s report 12/4):
The CCI index at the top of chart plunged from overbought down into negative territory. Notice the dotted vertical lines that connect all other similar moves by CCI with the ROC readings at the bottom of the chart. Each of these set-ups was followed by corrections.
MACD (not shown) has made a negative crossover, but RSI is holding just above the 50 level (51). Chaikin Money Flows are quickly retreating towards zero.
The stock market was up for the week, and this may have provided support for the gold stocks. If the dollar rally continues, both the market and gold stocks will have a strong headwind to contend with.
The indicators and the gap down on expanding volume suggest more downside is likely, but price is the final arbiter, and as of now, support is holding. If support doesn’t hold, the next target would be the lower yellow zone.
[Chart from last week’s report 12/4]
As stated earlier, the above is a short excerpt from the full market wrap report. Please excuse the lack of smooth transition from one section to the next, as a great amount of information has been left out in respect to full time subscribers. For a free trial subscription send an email request to dvg6@comcast.net.
Good luck. Good trading. Good health, and that’s a wrap.

Come visit our website: Honest Money Gold & Silver Report
New Audio-Book Now Available - Honest Money
Douglas V. Gnazzo
Honest Money Gold & Silver Report
About the author: Douglas V. Gnazzo writes for numerous websites and his work appears both here and abroad. Mr. Gnazzo is a listed scholar for the Foundation for the Advancement of Monetary Education (FAME).
Disclaimer: The contents of this article represent the opinions of Douglas V. Gnazzo. Nothing contained herein is intended as investment advice or recommendations for specific investment decisions, and you should not rely on it as such. Douglas V. Gnazzo is not a registered investment advisor. Information and analysis above are derived from sources and using methods believed to be reliable, but Douglas. V. Gnazzo cannot accept responsibility for any trading losses you may incur as a result of your reliance on this analysis and will not be held liable for the consequence of reliance upon any opinion or statement contained herein or any omission. Individuals should consult with their broker and personal financial advisors before engaging in any trading activities. Do your own due diligence regarding personal investment decisions. This article may contain information that is confidential and/or protected by law. The purpose of this article is intended to be used as an educational discussion of the issues involved. Douglas V. Gnazzo is not a lawyer or a legal scholar. Information and analysis derived from the quoted sources are believed to be reliable and are offered in good faith. Only a highly trained and certified and registered legal professional should be regarded as an authority on the issues involved; and all those seeking such an authoritative opinion should do their own due diligence and seek out the advice of a legal professional. Lastly Douglas V. Gnazzo believes that The United States of America is the greatest country on Earth, but that it can yet become greater. This article is written to help facilitate that greater becoming. God Bless America.
Douglas V. Gnazzo © 2009 All Rights Reserved
© 2005-2022 http://www.MarketOracle.co.uk - The Market Oracle is a FREE Daily Financial Markets Analysis & Forecasting online publication.


