


Weekly Gold and Silver Technical Analysis Report - 22nd July 2007 - Technically Precious with Merv
Commodities / Gold & Silver Jul 22, 2007 - 09:46 AM GMTBy: Merv_Burak
 All in all, a pretty good week. The major gold Indices are finally breaking out of their year long lethargy and may be making a dash towards the 2006 highs. Is this the start of something big?
GOLD
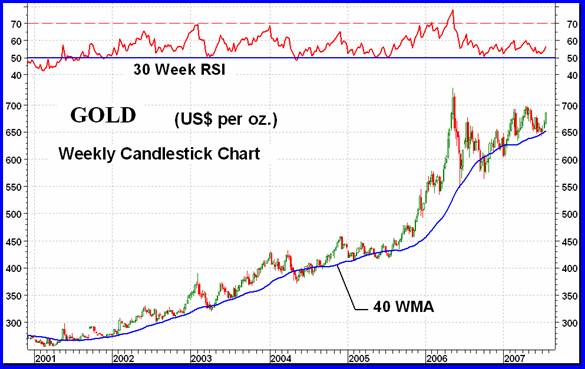
Ever since both the long term moving average and momentum (RSI) first turned positive together in Aug of 2001 (with gold price @ $268) gold has remained bullish. Using the popular simple 40 week (200 day) moving average one can easily see the bullish trend throughout. There were a few periods when it looked like a reversal in process but at no time during this period have both turned negative at the same time. The moving average is the most important indicator of a reversal of trend. The momentum indicator is a very good confirmation or advance warning of a potential reversal ahead. I like to have both confirming each other. I use a slightly more aggressive 40 week weighted moving average and with that one there was a period of a couple of weeks in May of 2004 when both went negative, but only for a couple of weeks. The price remains well above its moving average line but the momentum continues to show weakness, although still in the positive zone. The price rise in gold since its low last October has not seen a similar positive move in the momentum. It would be good to see gold go through the $700 level along with the RSI breaking above 60% (or 57% using a daily chart).
The direction of the plot on the long term P&F chart shown here on 29 June 2007 has now reversed to the up side with X 's. It still needs $705 to move above recent highs but it is moving in the right direction.
The moving average and momentum has already been mentioned above. As for the volume indicator, it has turned towards to up side but is still below its negatively sloping trigger line. Another week or two of upside action may still be required to turn this indicator positive.
With the recent upside action I am upgrading the rating back to a BULLISH rating.
INTERMEDIATE TERM
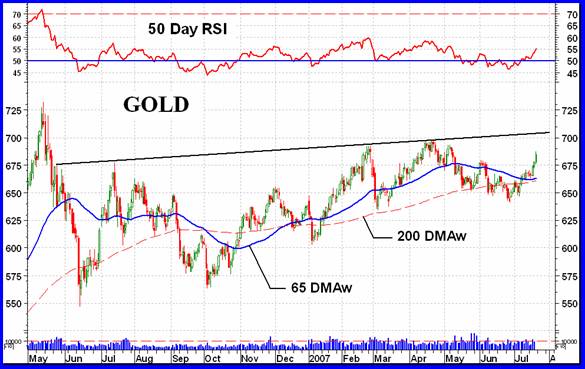
During an up trend one rarely will see an up trend line drawn through rally highs, except as the upper trend line off a channel. However, it is sometimes instructive to draw such a line as a suggestion of resistance level in an up trend. We have at least three, possibly four, highs to define the resistance line here so if this latest move should continue the level to watch would be this resistance line. In addition, as already mentioned when discussing the long term, we have a weak momentum indicator. It would be great if this momentum should move into new year long highs, into the 60% level. Although not that noticeable, the moving average line has now turned upwards confirming the price direction move.
With this past week's action the intermediate term P&F chart has turned back to the bullish side projecting to the $735 level. With the P&F back on the positive side and the indicators also positive I am back to the BULLISH rating for the intermediate term.
SHORT TERM
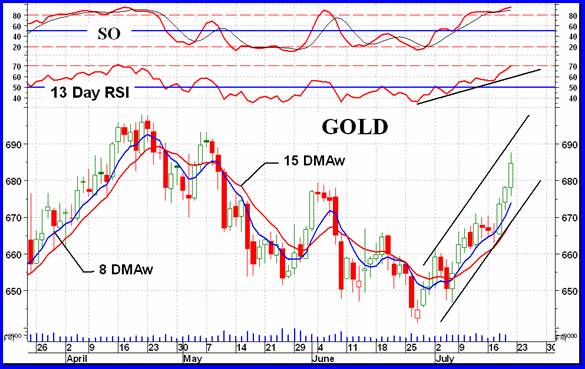
Last week it looked like a possible short term topping but in the end I continue “with the trend in motion”. Well, there are new indications of a potential top ahead but the trend in motion continues to be to the up side. Gold is above its positive sloping short term moving average line (15 DMAw) and the short term momentum remains positive. The cautionary indication is that the momentum is just about to enter its overbought zone. It is, in fact, at the same location it was at in April when it did top out. Although there may still be more upside ahead the momentum indicator is providing a strong warning that this may not be the time to be putting any new money into gold. Better to be safe than sorry.
IMMEDIATE TERM
Gold continues to move higher above its very short term moving average line (8 DMAw) and the aggressive Stochastic Oscillator (SO) continues in its positive zone. The SO is already inside its overbought zone and moving in a more lateral manner. As with the short term RSI we see that the SO is where it had previously been in April, just before the reversal. Although the direction of action continues to be towards the up side one should, at this point, be very cautious about a reversal.
NORTH AMERICAN GOLD INDICES
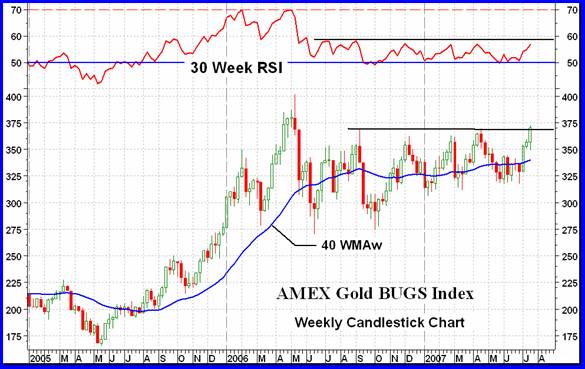
Doing the rounds we're back to the AMEX Gold BUGS Index (HUI) this week as far as a look at the majors are concerned. For the first time in almost a year the HUI has now moved above resistance. The next event would be a new high into the 400 level. Except for the S&P/TSX Global Gold Index all the other major Indices have now moved above their year long resistance levels and are heading towards the 2006 highs. The weak spot here as with gold is the momentum indicator. Although positive it has not confirmed the price break-out and is still showing weakness. This might change over the next few weeks but is something to keep in your memory banks.
MERV'S PRECIOUS METALS INDICES
Over the past several weeks I have been mentioning the “potential” double top in the Merv's Composite Index of Precious Metals Indices. I had emphasized the potential nature of the double tops as they are only potential until verified. Well, this week the Composite Index made a new all time high exceeding the previous double top levels. It was not by much and could still reverse but it looks more like further highs are to come in the future, nullifying the potential double top. As with all other Indices the one cautionary indicator is the momentum indicator. It has not yet confirmed the new high in the Index but could do so in a week or two.
MERV'S GOLD & SILVER 160 INDEX
Unlike the major Indices which are still striving to exceed their 2006 highs the universe of 160 stocks had done so some time back. After a two month decline this Index is once more on the climb but not yet above its previous high of 3 months ago. All of the indicators are positive and both the intermediate and long term can be rated as BULLISH.
With a gain of only 1.2% on the week the average gold and silver stock was not all that bullish. The 4.0% plus gains of the majors reflects the good performance of Barrick Gold which is a major weight towards their Indices value. Overall, 89 stocks gained on the week (56%) and 41 lost (41%). As for the summation of individual ratings, all three time periods are now in the BULL camp with the short term at 75%, the intermediate term at 63% and the long term at 52%. Only one stock made it into my arbitrary plus/minus 30 % weekly performance category and that was on the down side. As anyone who has read the papers lately will know the one stock with a panic situation with fears about another Bre-X affair. I doubt that it will end up as bad as it sounds but who knows?
MERV'S QUAL-GOLD INDEX : MERV'S SPEC-GOLD INDEX : MERV'S GAMB-GOLD INDEX
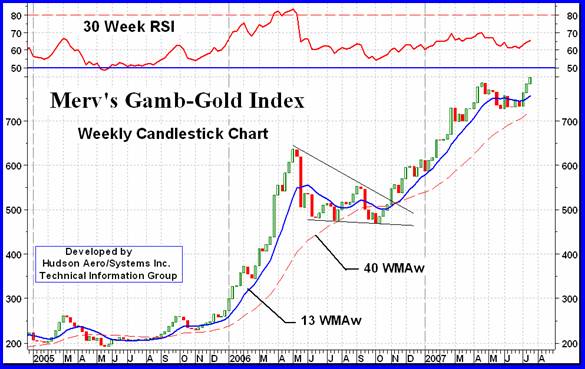
On the next page is the chart of the Merv's Gamb-Gold Index. Along with the Qual-Silver Index the Gamb-Gold Index has now moved into new all time high territory. It is some 25% above its 2006 high and moving higher. What a difference between this Index and the AMEX Gold BUGS Index (or the other major Indices). It sure demonstrates where the action is.
The average weekly performance of these three sector Indices was less than half the performance of the majors. The best of the three was the Qual-Gold Index at 2.3%, followed by the Spec-Gold Index at 1.9% and trailed by the Gamb-Gold Index at 1.7%. The advance/decline numbers reflected this performance. The Qual had 80% advancing issues, the Spec had 60% and the Gamb-Gold had only 47% advancing issues. Still, the better performer over the long term (i.e. 30 weeks) has been the Gamb-Gold Index. Except for the long term Gamb-Gold Index all the other Indices and time periods have their summation of individual ratings in the BULL camp. The BULL ratings are; short term Qual at 87%, Spec at 80% and Gamb at 68%. On the intermediate term; Qual at 78%, Spec at 68% and Gamb at 55%. On the long term; Qual at 68%, Spec at 68% while the Gamb-Gold Index is NEUTRAL.
All moving averages and momentum indicators are positive and moving higher. Therefore for the intermediate and long term all of the Indices can be rated as BULLISH.
SILVER
Over the past few weeks silver had out performed gold but it looks like that has ended with silver slightly under performing gold. I guess they are just taking turns. Silver just touched the January low level a few weeks back and has been rallying ever since. Such rally, however, is on very weak volume action and on weak momentum. Something tells me that the rally doesn't have much further to go before turning around. Both intermediate and long term moving averages have just barely turned to the up side although they are more horizontal in trend. The intermediate term momentum, although very weak, has just crossed into its positive zone. The long term momentum continues in the positive zone although also very weak. Although everything looks bullish on the two time periods the weakness of the indicators would give one some caution about jumping in and buying silver. Better to reduce the risk factor for a little less gain and wait for better trend confirmation.
MERV'S QUAL-SILVER INDEX : MERV'S SPEC-SILVER INDEX
Of the various Merv's Indices the Qual-Silver was near the best performer this past week with a gain of 2.1% (Qual-Gold did better at 2.3%). On the other hand, the Spec-Silver was the worst performer with a gain of only 0.6%. This is also reflected in the advance/declines with 70% of the Qual stocks on the advance and only 40% of the Spec stocks. As with Gamb-Gold, the long term Spec-Silver summation of ratings is still not in the bullish mode. In order from short to long term, the Qual-Silver ratings are 90%, 80% and 70% while for the Spec-Silver they are 72%, 50% and NEUTRAL.
As with the other Indices all of the indicators are in their positive zone and heading higher so we can rate the intermediate and long term for both Indices as BULLISH.
MERV'S PRECIOUS METALS INDICES TABLE
Well, that's it for this week.
By Merv Burak, CMT
Hudson Aero/Systems Inc.
Technical Information Group
for Merv's Precious Metals Central
Web: www.themarkettraders.com
e-mail: merv@themarkettraders.com
During the day Merv practices his engineering profession as a Consulting Aerospace Engineer. Once the sun goes down and night descends upon the earth Merv dons his other hat as a Chartered Market Technician ( CMT ) and tries to decipher what's going on in the securities markets. As an underground surveyor in the gold mines of Canada 's Northwest Territories in his youth, Merv has a soft spot for the gold industry and has developed several Gold Indices reflecting different aspects of the industry. As a basically lazy individual Merv's driving focus is to KEEP IT SIMPLE .
To find out more about Merv's various Gold Indices and component stocks, please visit www.themarkettraders.com and click on Merv's Precious Metals Central . There you will find samples of the Indices and their component stocks plus other publications of interest to gold investors. While at the themarkettraders.com web site please take the time to check out the Energy Central site and the various Merv's Energy Tables for the most comprehensive survey of energy stocks on the internet. Before you invest, Always check your market timing with a Qualified Professional Market Technician
Merv Burak Archive |
© 2005-2022 http://www.MarketOracle.co.uk - The Market Oracle is a FREE Daily Financial Markets Analysis & Forecasting online publication.