Financial Market Bubble Dynamics In 2010
Stock-Markets / Financial Markets 2010 Jan 11, 2010 - 12:21 PM GMTBy: Captain_Hook
 If asked the question, most ‘financial experts’ would likely tell you the possibility of a return to extreme bubble dynamics in stocks during 2010 is the most unlikely possibility, not after all the ones during the last decade. Besides the possibility of deflation Prechter and the likes sell to a public that sees the risks, which are in fact very real, because this is widely known and being countered by central authorities, a risk of opposites must also be considered – or so the charts tell us. That is to say, not only because of the true state of inflation, but also because of the mechanisms influencing and controlling the direction of our faulty and fraudulent markets, which will be discussed in further detail below, you should know the chances of returning to a state of extreme bubble dynamics in stocks does in fact exist moving forward, this, and all that goes along with it.
The following is commentary that originally appeared at Treasure Chests for the benefit of subscribers on Tuesday, December 29th, 2009.
What all would go along with renewed bubble dynamics in stocks? Well, for one thing, on a relative basis price managers would have an easier time keeping precious metals out of the limelight for a while. After all, who needs gold or silver when one can use rapidly appreciating tech stocks as currency, right? Heaven knows given the opportunity the Boys From Brazil (they are a bunch of not so little Hitlers) on Wall Street will surely find ways to exploit all avenues. Of course another aspect of all this would be that although gold and silver would not be in the limelight in terms of percentage gains, still, they would appreciate, taking them ever closer to where they should be. And later they would move back front and center again, once all the excitement in stocks had settled down, when the hangover associated with another credit binge began to set in.
Another credit binge – impossible right? Wrong. It’s not impossible for the desperate bubbleheads running our governments and central banks who are fuelling the most profound inflation in history everyday on your behalf, with all the new bailouts, spending, and entitlement programs that must be paid for somehow. Like the Fed’s own birth in the eleventh hour on Christmas of 1913, new health care entitlements in the US will ensure the printing presses will need to be cranked up a few more notches – an inevitable outcome of an unfunded social state. Monetize this and monetize that will increasingly be the norm in 2010 if the charts don’t lie, and the looming breakouts discussed below become a reality. What’s more, this also explains how the system should be able to handle a rate hike or two, given not much past this would likely maintain the ‘smoke and mirrors’ for long.
And the potential crash such undertakings would set-up eventually, all it would take is the appropriate shift in sentiment (discussed below) and something quite remarkable in this regard could transpire. Here, if the Fed were to actually carry through with this threat we would likely have a reason for stocks to top, say in March just like in the year 2000 at the last decennial turn. Personally I can’t see this happening myself no matter what the inflation picture looks like moving forward this year, not with all the mortgages coming due. Such propaganda, while attempting to gain back some of the Fed’s lost credibility, certainly qualifies as a good reason for speculators to buy more puts on stocks (and bonds) however, which as you may know, in the workings of our faulty and fraudulent markets, would enable a continued short squeeze.
What’s more, and as I was alluding to above, this is exactly what the charts are suggesting we should expect – believe it or not. As an example of this, of which several will be provided (and many more could be), we have the NASDAQ / Dow Ratio, where as you can see on the long-term plot from the Chart Room found below, values are threatening to break back into bubble territory, and the indicators are suggestive this is exactly what is going to happen. In this regard it should be noted RSI has broken out of a massive diamond, which is very bullish from a technical perspective, tested the breakout in a classical manner, and then continued higher (and looks like it’s ready to bust a move to the indicated target, which would undoubtedly take the broad measures of stocks to some degree of bubble dynamics led by the high beta (volatile) tech stocks just like in 2000. (See Figure 1)
Figure 1
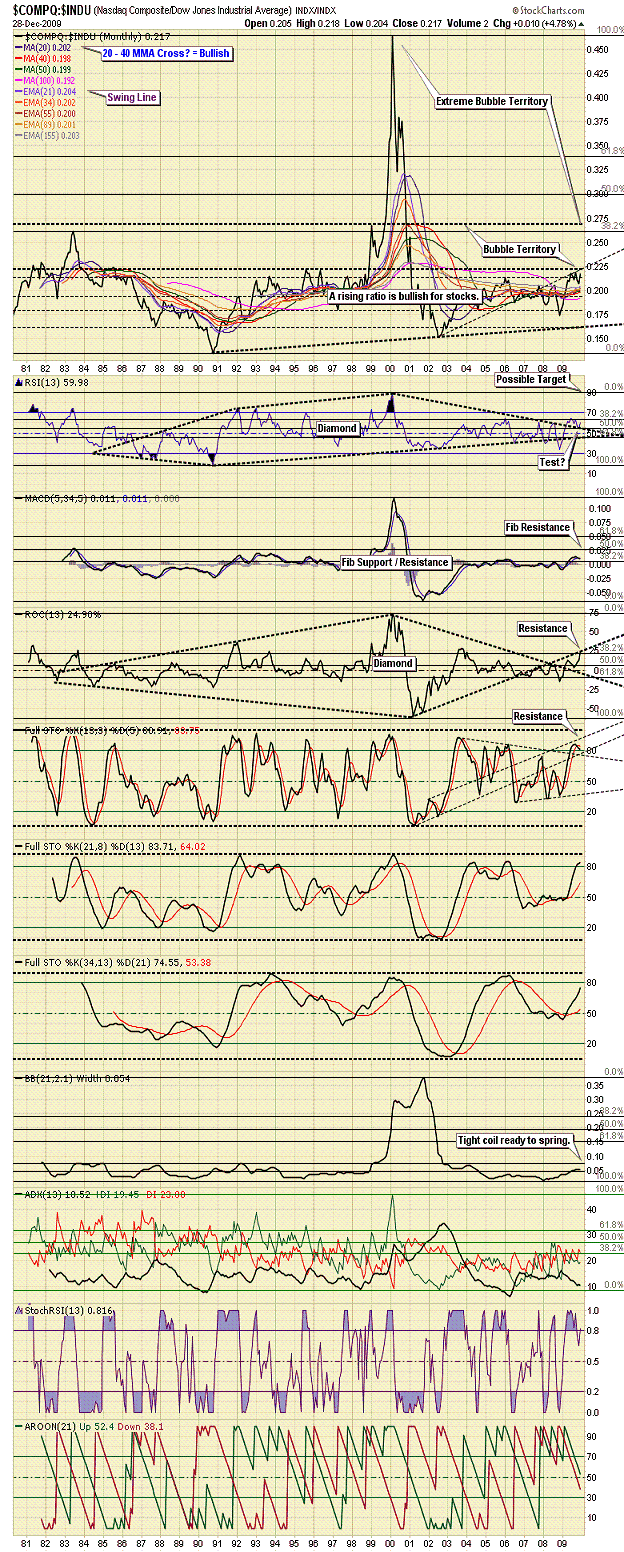
How can this be, with stocks at the 50% retrace off the March lows, and so any expecting the opposite? This is of course the answer, that so many are expecting such an outcome and are short, evidenced by a surge in US index open interest put / call ratios discussed the other day. You know what this means in our faulty and fraudulent markets that are based more on speculation and liquidity (the formula for a short squeeze) than fundamentals. It means stocks are most likely going higher, possibly much higher if extreme bubble like conditions were ever to return. A break back into extreme bubble conditions in stocks does not necessarily mean a double top, or new highs in the NASDAQ / Dow Ratio are in the cards, however if money coming out of a very large bond bubble is looking for a new home, who knows how ridiculous stock valuations could get.
Now history has taught us bubbles of this degree do not strike twice in the same markets within a generation, which makes such an outcome improbable. If this is true though, then how could stocks enter bubble (possibly extreme) like conditions again? Answer: Because the extreme bubble this time around is in government finance, the bond market, and monetization, and stocks (along with everything else) are just riding the sea of liquidity. Money coming out of the bond market will need to go somewhere if it’s not used to payoff debt. What’s more, if you subscribe to Martin Armstrong’s viewpoint, that stocks did not see the mania top back in 2000 or 2007, and that all the money coming out of ‘immoveable assets’ will be looking for a home, preferably outside bureaucracy plundering capabilities, it certainly does. When looked at in this light, all of a sudden, this picture becomes a whole lot more probable.
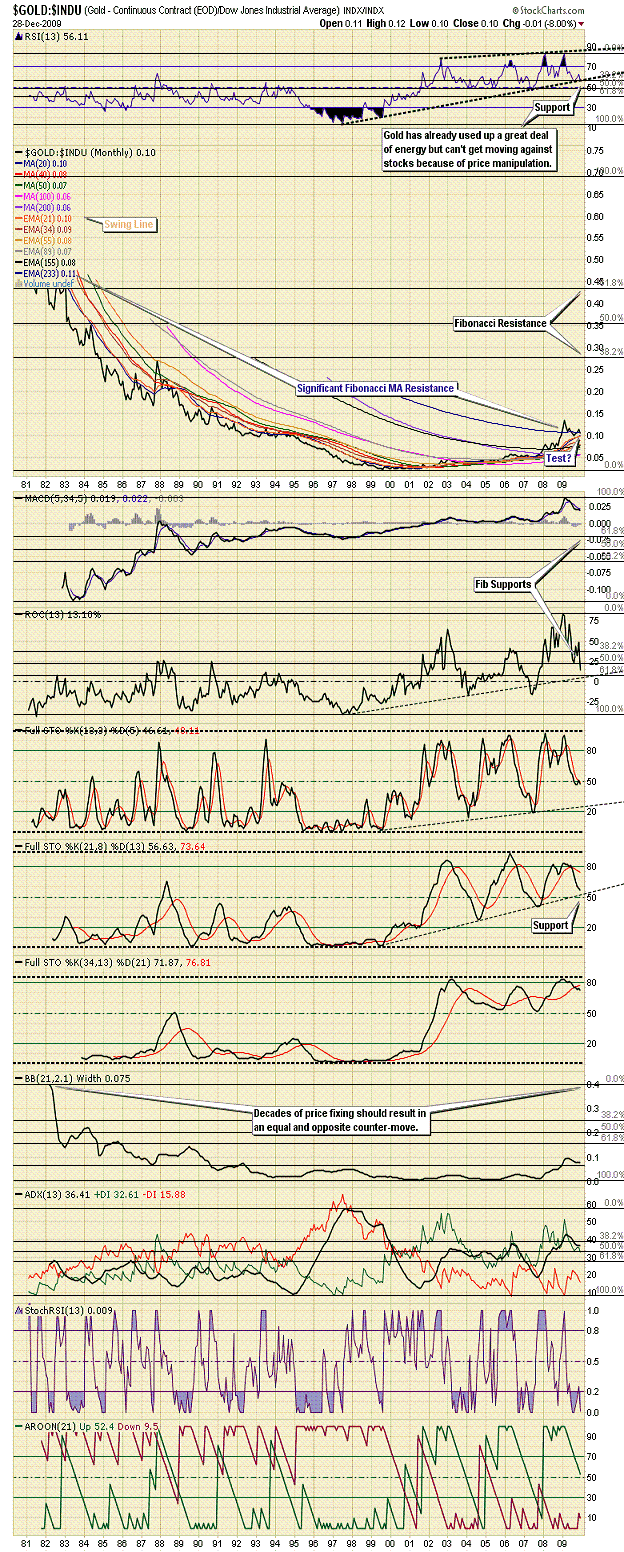
And one would naturally think gold should benefit from this as well, with liquidity leaving the bond market, however like back in 2000, whenever possible it’s minimized by the bureaucracy even if the reasoning is counterintuitive in nature. Anything to keep their precious stock markets in the limelight as opposed to precious metals, and attention off the real bubble in government finance, their spending, and deficits. This is why they will not get far with such a ploy in my opinion; and why a break of support in RSI on the chart below, a long duration monthly plot of the Gold / Dow Ratio, should prove false in nature. And who knows, perhaps a breakdown is avoided all together, as again, who do these people in the bureaucracy think they are fooling. Bonds are under pressure because nobody wants to buy them anymore, including the Chinese even though it will hurt their exports, which means even more monetization and loose money will need to be injected into the system in 2010. (See Figure 2)
Figure 2
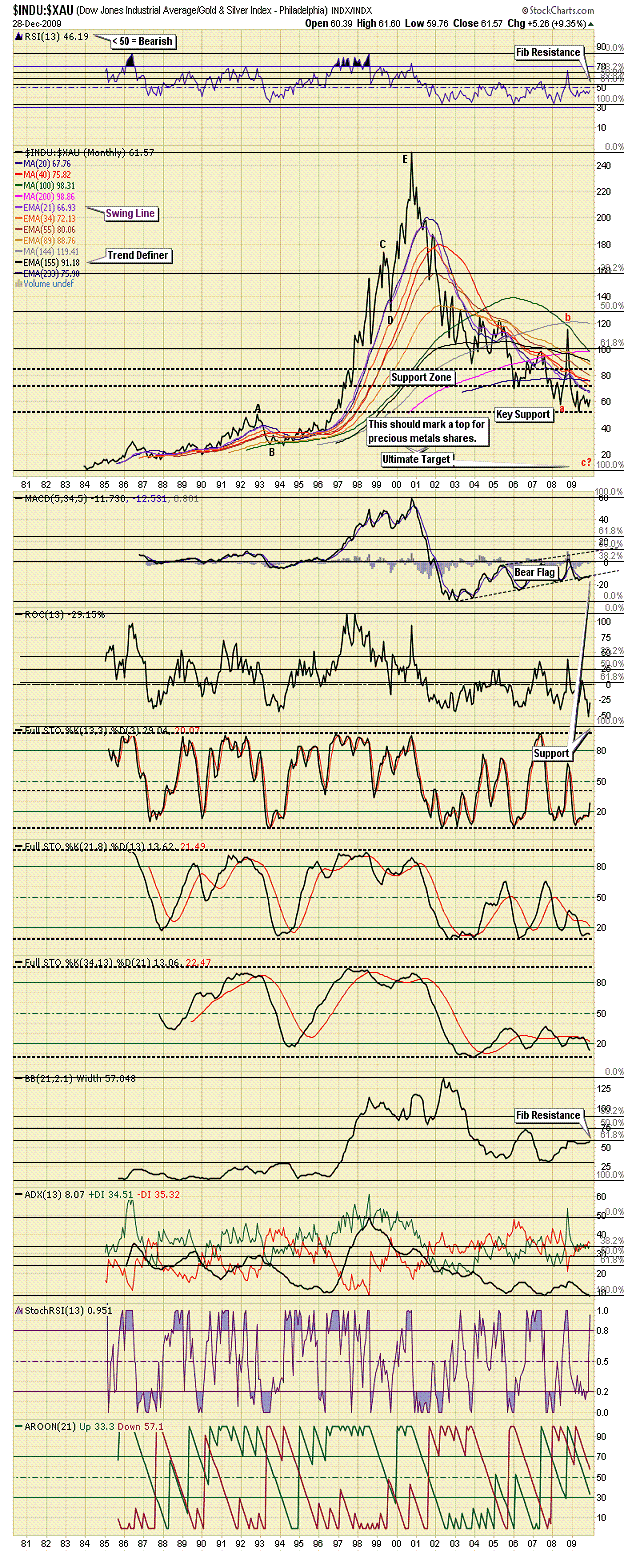
Further to this vein of thinking, and even though like the Gold / Dow Ratio, a rigorous testing process at the monthly swing line might be necessary, I also do not see the broad measures of stocks outperforming precious metals shares for long either, not if the bear flag in the MACD on the monthly plot featured below holds any predictive value. That is to say, while the bureaucracy’s price managers may continue to get their way for longer, eventually the investing public will wake up and smell the coffee, meaning premiums in precious metals shares relative to just about all other asset classes should continue to build. (See Figure 3)
Figure 3
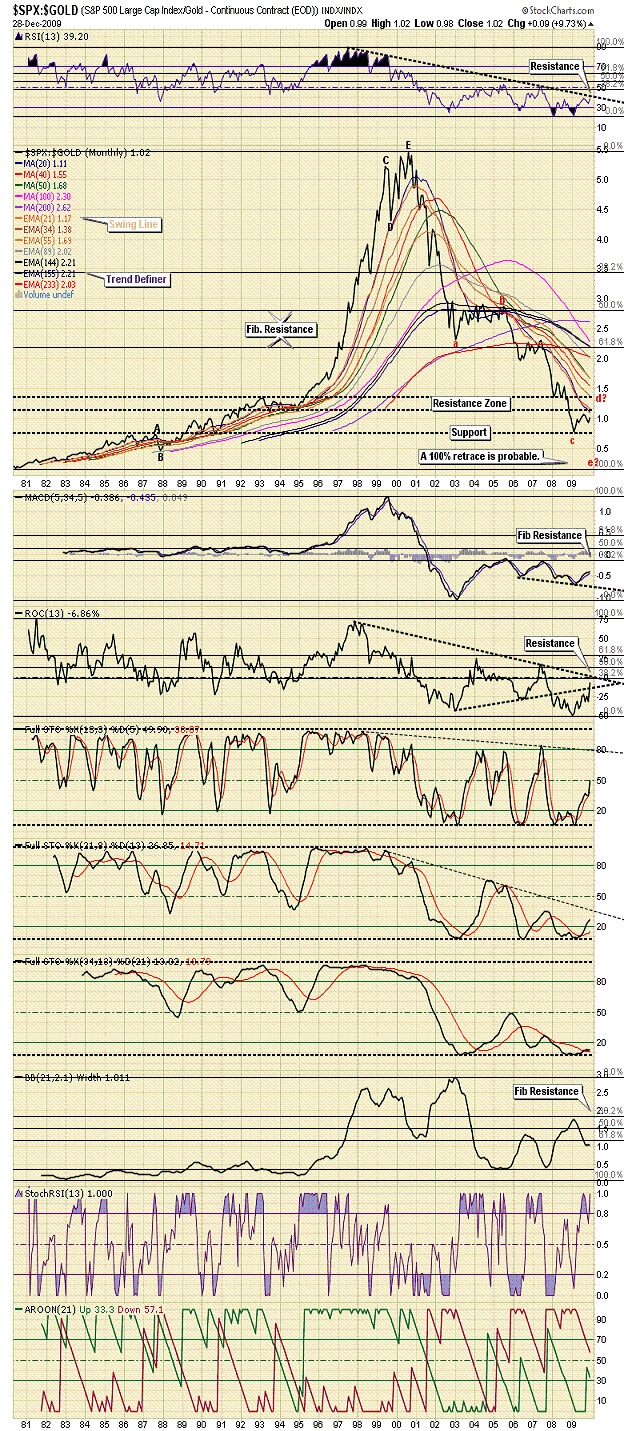
Again however, we do have those pesky bureaucrats to put up with along the way. And again, they will do their damdest to draw attention away from precious metals by painting a faulty picture whenever possible, which is exactly what the case is with respect to the disposition of the S&P 500 (SPX) / Gold Ratio. And again, while this picture is suggestive stocks should enjoy a period of relative strength moving forward; again, it’s difficult for those realizing increasing monetization next year could mean hyperinflation to see this relationship making a lasting reversal, especially with the count pointing to lower values. So, we will likely continue to correct back above the psychologically important unity mark into early next year as put buyers are squeezed out of their positions, however past a move that scares technicians with a false RSI breakout, it’s difficult seeing such a move have legs much past the swing line. (See Figure 4)
Figure 4
Of course if the SPX / VIX Ratio were to plow through the trend defining 155-month exponential moving average (EMA) I may need to change my tune in this respect, as stocks will be all the rage once again. Naturally the thing to remember however is the charts do represent lies –being faulty, fraudulent, and manipulated. We know this because the more pessimistic traders become on stocks (or any market that has derivative based side betting markets that can influence outcomes – think ETF’s, options, futures) the more buoyant they become. And this is exactly what is happening right now. And this is not only the case now with key US index open interest put / call ratios surging higher (see above), but this was also the case back at millennium’s turn in fuelling the tech wreck as well, which must be viewed as the base cause of any new extreme bubbles here, even above considerations put forward by Martin above. None of this would happen if there were nobody to squeeze you see. (See Figure 5)
Figure 5
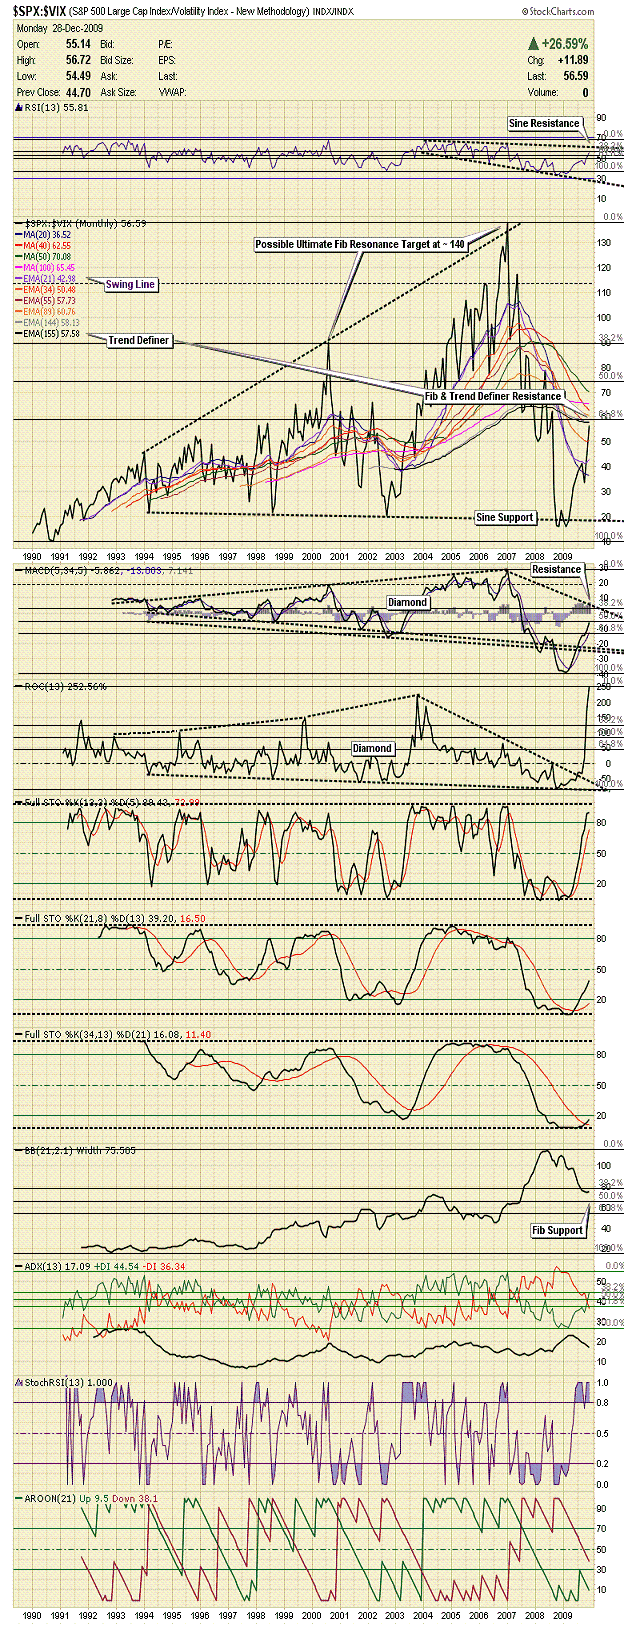
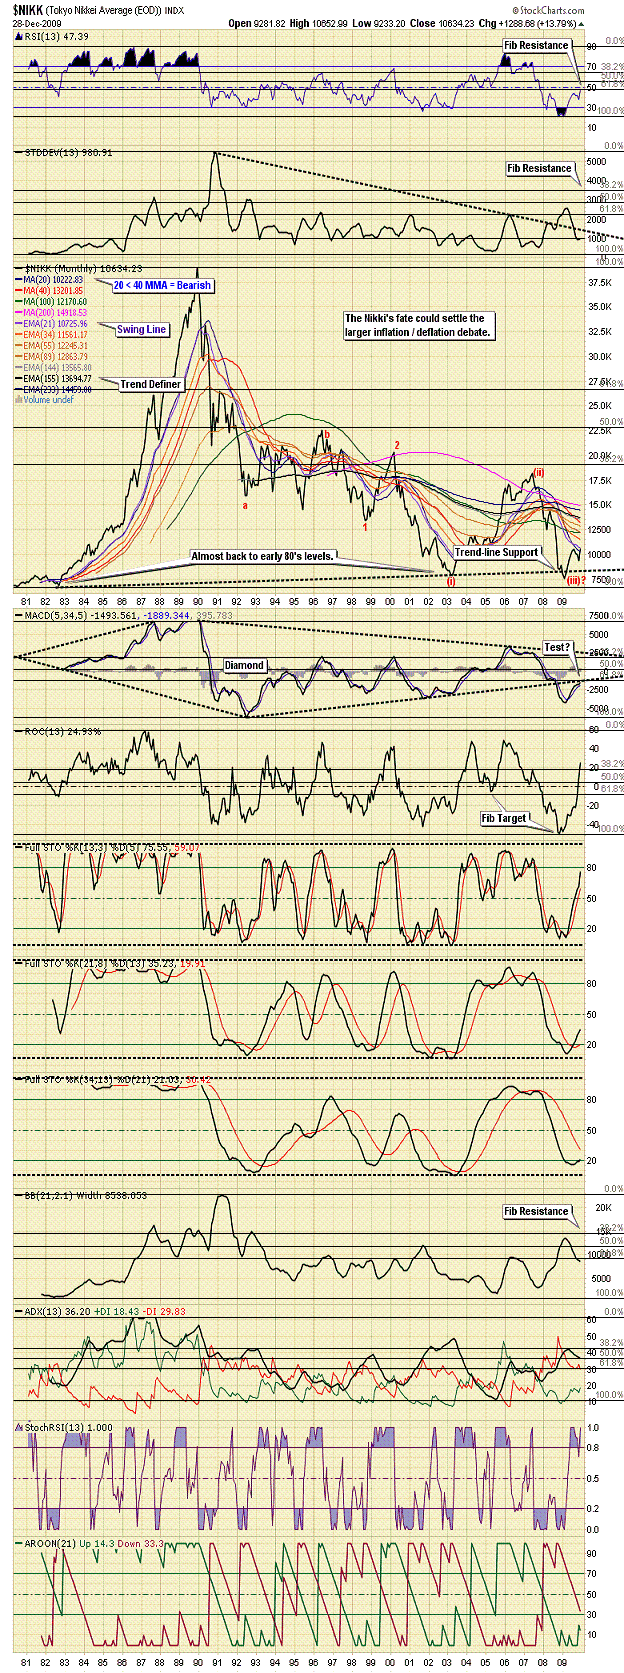
This is a chart I have not shown you in quite some time as it’s relevance up until very recently has been undetectable. This has all changed however, as the SPX / VIX Ratio is now approaching both Fibonacci resonance and trend definer resistance, where if this congestion zone were to go, stocks would be ‘tripping the light fantastic’ on the upside once again, especially if RSI takes out sine resistance. Further to this, and to broaden the scope of this study, it should also be recognized the Nikki is also approaching important resistance (swing line), and it should also be realized Japanese stocks breaking above this resistance would be an inflation signal that should not be ignored. The Nikki is still 75% off its all time highs 20-years ago, and is the global symbol for deflation, meaning inflationary signals emanating from this market would be profound. (See Figure 6)
Figure 6
Unfortunately we cannot carry on past this point, as the remainder of this analysis is reserved for our subscribers. Of course if the above is the kind of analysis you are looking for this is easily remedied by visiting our continually improved web site to discover more about how our service can help you in not only this regard, but also in achieving your financial goals. For your information, our newly reconstructed site includes such improvements as automated subscriptions, improvements to trend identifying / professionally annotated charts, to the more detailed quote pages exclusively designed for independent investors who like to stay on top of things. Here, in addition to improving our advisory service, our aim is to also provide a resource center, one where you have access to well presented 'key' information concerning the markets we cover.
And if you have any questions, comments, or criticisms regarding the above, please feel free to drop us a line. We very much enjoy hearing from you on these matters.
Good investing all.
By Captain Hook
http://www.treasurechestsinfo.com/
Treasure Chests is a market timing service specializing in value-based position trading in the precious metals and equity markets with an orientation geared to identifying intermediate-term swing trading opportunities. Specific opportunities are identified utilizing a combination of fundamental, technical, and inter-market analysis. This style of investing has proven very successful for wealthy and sophisticated investors, as it reduces risk and enhances returns when the methodology is applied effectively. Those interested in discovering more about how the strategies described above can enhance your wealth should visit our web site at Treasure Chests
Disclaimer: The above is a matter of opinion and is not intended as investment advice. Information and analysis above are derived from sources and utilizing methods believed reliable, but we cannot accept responsibility for any trading losses you may incur as a result of this analysis. Comments within the text should not be construed as specific recommendations to buy or sell securities. Individuals should consult with their broker and personal financial advisors before engaging in any trading activities, as we are not registered brokers or advisors. Certain statements included herein may constitute "forward-looking statements" with the meaning of certain securities legislative measures. Such forward-looking statements involve known and unknown risks, uncertainties and other factors that may cause the actual results, performance or achievements of the above mentioned companies, and / or industry results, to be materially different from any future results, performance or achievements expressed or implied by such forward-looking statements. Do your own due diligence.
Copyright © 2010 treasurechests.info Inc. All rights reserved.
Unless otherwise indicated, all materials on these pages are copyrighted by treasurechests.info Inc. No part of these pages, either text or image may be used for any purpose other than personal use. Therefore, reproduction, modification, storage in a retrieval system or retransmission, in any form or by any means, electronic, mechanical or otherwise, for reasons other than personal use, is strictly prohibited without prior written permission.
Captain Hook Archive |
© 2005-2022 http://www.MarketOracle.co.uk - The Market Oracle is a FREE Daily Financial Markets Analysis & Forecasting online publication.


