


Technical Update On IEF And TLT
Interest-Rates / US Interest Rates Jan 15, 2010 - 02:47 PM GMTBy: Guy_Lerner

 When we last looked at longer term Treasury yields, I stated that longer term Treasury yields were likely to undergo a secular trend change from down to up, but I had reservations because significant resistance was overhead, sentiment was too bullish for higher yields, and Treasury yields were greatly overbought. Honestly, last week I was not sure which way the bond market was going to go but I did offer up a game plan. This article will review the game plan that now have me more constructive on bonds or bearish on Treasury yields.
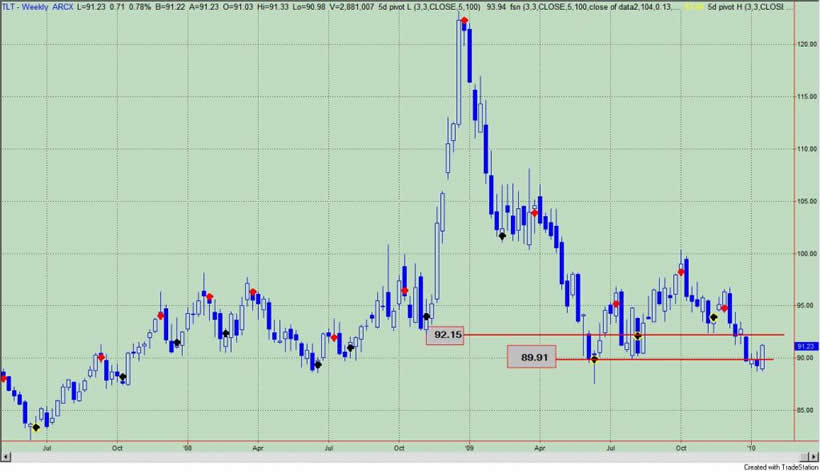
Figure 1 is a weekly chart of the i-Shares Lehman 20+ Year Treasury Bond Fund (symbol: TLT). Key pivot points are designated by the black dots within the yellow dots. What are key pivot points? Key pivot points are special pivot points as they are a pivot point low occurring at a time when investor sentiment towards an asset is bearish. Typically, these price levels are areas of buying or selling that result in either support or resistance.
Figure 1. TLT/ weekly
Despite the bearish implications of price closing below 3 key pivot points, I did state that I would be more constructive on long term Treasury bonds if TLT closed above the key pivot low point at 89.91 on a weekly basis. This is likely to happen at the close of trading today. This level, which was resistance, now becomes support, and it should be noted that a weekly close back below 89.91 is bearish. I would become very constructive on TLT on a weekly close above 92.15, which is the next key pivot point or level of resistance.
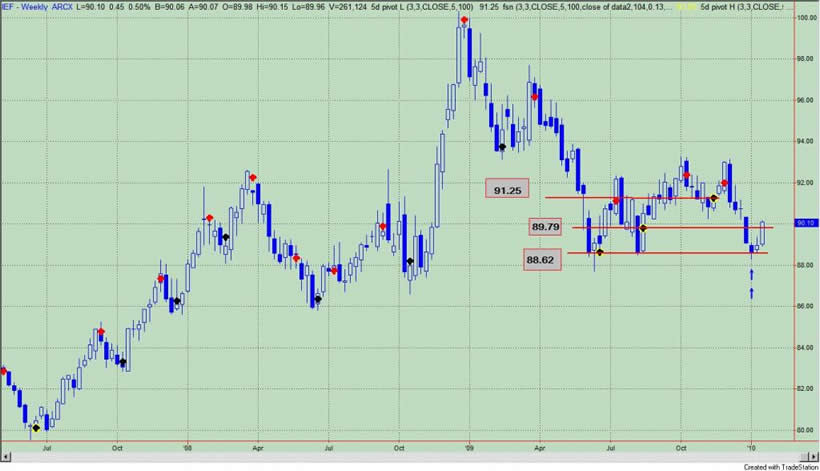
Figure 2 is the the i-Share Lehman 7-10 Year Treasury Bond Fund (symbol: IEF). Three weeks ago IEF closed the week at 88.60, which was 2 cents below the key pivot low point. Last week, this level was recaptured and suggesting that this is a significant level of support. This is constructive suggesting a reversal was in the works, and this week's close above the key pivot point at 89.79 is bullish. 80.79 is now support, and a weekly close below this level is suspect. A weekly close above the key pivot at 91.25 suggests a run to $94 to $96.
Figure 2. IEF/ weekly
How am I squaring the long term secular story for higher Treasury yields with the current and more intermediate term rise in Treasury bonds? We have been down this road several times in the past 12 months, and you have had to be very nimble to capture profits when betting on higher bond prices. Maybe this time will be different. Maybe the current reversal will result in a more tradeable rally for Treasury bonds. Regardless, we have our sign posts (i.e., key pivot levels) marked and we will interpret the price action as we go.
By Guy Lerner
http://thetechnicaltakedotcom.blogspot.com/
Guy M. Lerner, MD is the founder of ARL Advisers, LLC and managing partner of ARL Investment Partners, L.P. Dr. Lerner utilizes a research driven approach to determine those factors which lead to sustainable moves in the markets. He has developed many proprietary tools and trading models in his quest to outperform. Over the past four years, Lerner has shared his innovative approach with the readers of RealMoney.com and TheStreet.com as a featured columnist. He has been a regular guest on the Money Man Radio Show, DEX-TV, routinely published in the some of the most widely-read financial publications and has been a marquee speaker at financial seminars around the world.
© 2010 Copyright Guy Lerner - All Rights Reserved
Disclaimer: The above is a matter of opinion provided for general information purposes only and is not intended as investment advice. Information and analysis above are derived from sources and utilising methods believed to be reliable, but we cannot accept responsibility for any losses you may incur as a result of this analysis. Individuals should consult with their personal financial advisors.
Guy Lerner Archive |
© 2005-2022 http://www.MarketOracle.co.uk - The Market Oracle is a FREE Daily Financial Markets Analysis & Forecasting online publication.