


The Four Year Stock Market Cycle Statistics Continue to Suggest that this Low Lies Ahead
Stock-Markets / Cycles Analysis Jul 28, 2007 - 05:50 PM GMTBy: Tim_Wood
 It certainly seems that the controversy surrounding the 4-year cycle is still alive and well and has been ever since the June/July 2006 low. I have studied many of the works by Edward Dewey, J. M Hurst, N.D. Kondratieff, Walter Bressert, and numerous other writings through what used to be the Foundation for the Study of Cycles. The consensus among credible cycles analysts is that cycles are not rigid in nature, but that they are somewhat flexible in their ebb and flow.
Let's first begin with a few simple examples of cycles. Cycles are a part of everyday life. Our breathing and heartbeat are cycles. The changing of the seasons from summer to fall to winter and then to spring is a cycle. The migration of birds and breeding patterns of animals and fish are also examples of rhythm in nature that we call “cycles.” Yet, these cycles like many other cycles do not have a fixed periodicity. Just because the summer runs into the fall certainly does not mean that winter won't follow.
I also want to point out that when we are dealing with a cycle that is only a few days long, then the normal variation or fluctuation will obviously be much less than in the case of an annual cycle like the changing of the seasons or the migration pattern of birds, which could vary for a number weeks or perhaps even a month or so. When we are dealing with very long cycles such as the ice ages, the cycle can vary thousands of years. Nonetheless, cycles still exist as do the fluctuations or variations of these cycles and these variations are proportional to the duration of the cycle. To think that the business cycle or any other cyclical behavior related to the economy is any different or that they are fixed and/or rigid in nature is a common mistake made by many “cycle analysts.”
When it comes to the stock market I think we all agree that the October 2002 low definitely marked a 4-year cycle low. The disagreement however seems to be centered primarily around the July 2006 low, which conveniently occurred some 45 months after the October 2002 low. If so called 4-year cycles were rigid in nature, then the July 2006 low would not qualify as the 4-year cycle low anyway, because it would have been some 3 months early. Hmmm! So, much for the fixed cycles theory. In any event, it seems that everyone that is even remotely familiar with the 4-year cycle in the stock market still insists on proclaiming that the July 2006 low marked the last 4-year cycle low.
As the market turned up out of the July 2006 low my indicators triggered buy signals the week of July 28, 2007 that remained positive all the way into January 2007. I told my subscribers that a buy signal had indeed been triggered, but that the July 2006 low was not the 4-year cycle low. Then, came the February 2007 top and the drop into the March 2007 low. At that time there was again talk about the March 2007 low having marked the 4-year cycle low. Then, the week of March 23, 2007 my Cycle Turn Indicator triggered yet another buy signal and I said then, yet again, that a buy signal had been triggered, but that the March low was not the 4-year cycle low.
The first week of June the weekly Cycle Turn Indicator triggered an intermediate-term sell, which served to invalidate the previous buy signal that was given in March. Since that time the Cycle Turn Indicator has continued to do a beautiful job at calling market turns. All the while the statistical data and the markets surrounding the 4-year cycle have continued to suggest that the 4-year cycle low has not been made and that the 4-year cycle low actually still lies ahead.
Sometimes, cycle analysis can be as simple as counting from one low to the next and saying that at a predetermined interval a cycle low has occurred. But, more often than not cyclical analysis, or any other market analysis for that matter, is far more complex and trying than a simple count. I believe that in many cases the belief that the 4-year cycle low is behind us has been adopted because of two primary reasons. One, most people only play lip service to cycles and do not have or understand the underlying data or the true nature of market cycles. Secondly, such opinion is simply the easy way out. Easy or not, I have to follow the data and as a result I cannot agree that the 4-year cycle low has been seen. The data simply does not support it.
Since the inception of the Dow Jones Industrial Average in 1896 the so-called 4-year cycle has averaged 47.04 months. Even though neither the July 2006 low nor the March 2007 low fell on exactly the 48 th month from the October 2002 low I will admit that strictly based on the count alone either one of these lows make sense strictly based on the monthly count. But again, if the 4-year cycle ran on a fixed periodicity, neither of these lows would qualify because one is short and the other is too long.
However, there are other factors in cyclical identification and among them are certain “markers” that I have identified to help recognize 4-year cycle tops and bottoms. According to these markers, which have been present at all 4-year cycle tops and bottoms over the last one hundred and ten years, there is still no evidence that a 4-year cycle top or bottom has occurred since the October 2002 low. Sure there is always a first time for everything, but given a hundred and ten years of history and a 100% track record, to bet against these markers is definitely a bet against the odds. Until proven otherwise, I have to side with the odds.
This in turn means that all of the price action since the 2002 low still appears to be within the context of the same 4-year cycle. It is important for you to understand that this view is based on quantitative data and is not a bias or subjective opinion. July 2007 marks the 57 th month of the current 4-year cycle and there have only been two other 4-year cycles of this duration. The first such mammoth 4-year cycle was 68 months in duration and advanced 56 months from its low to its high. The last such 4-year cycle was 62 months in duration and advanced for 60 months from low to high. The currently stretched and overdue 4-year cycle has advanced thus far for 57 months from its low of 7,197.49 in October 2002 into the most recent high at 14,021.95 for a total advance of 94.82%.
So, here we sit in what by default appears to be the 57 th month of the second longest advancing 4-year cycle in stock market history. Admittedly, this is an extreme, but again this is based strictly upon one hundred and ten years of statistics rather than hollow opinion. At the same time, the Primary Trend, according to Dow theory, continues to be positive. In the meantime and in addition to the statistics surrounding the 4-year cycle we also have seen the internals contracting and housing, as I have recently reported on, continuing to get creamed.
These are all indications that the 4-year cycle low has not occurred and that the low is likely still ahead. All the while, everyone thinks that the 4-year cycle low is behind and the public has been trained like Pavlov's dog to buy the dip. Guys, don't fall for the misconception that business cycles or cycles in the stock market adhere to some fixed periodicity. Unfortunately, the stock market world is just not that orderly. If it were we could all set our clocks by the cycle and we could then all buy at the exact bottom and sell at the exact top.
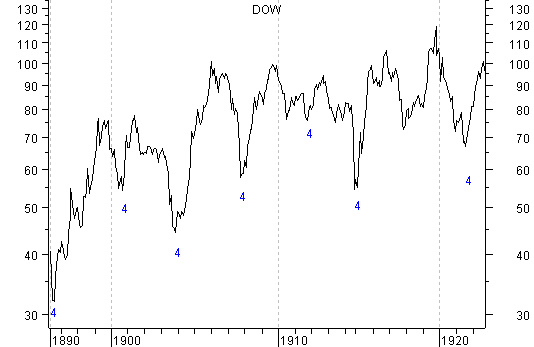
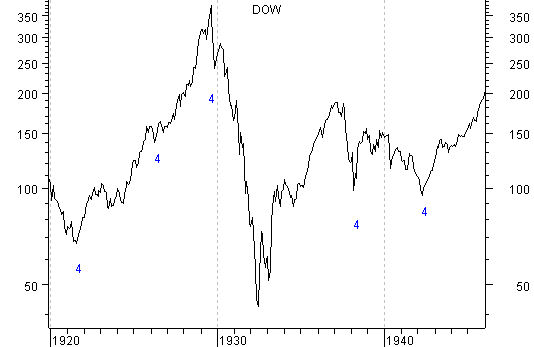
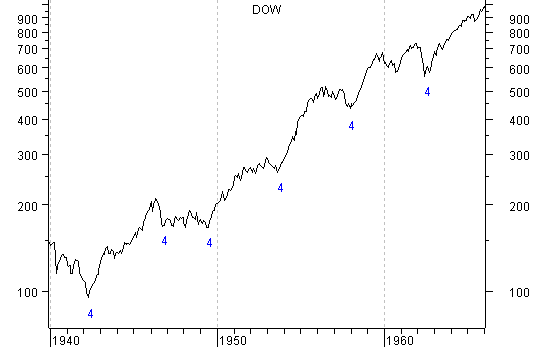
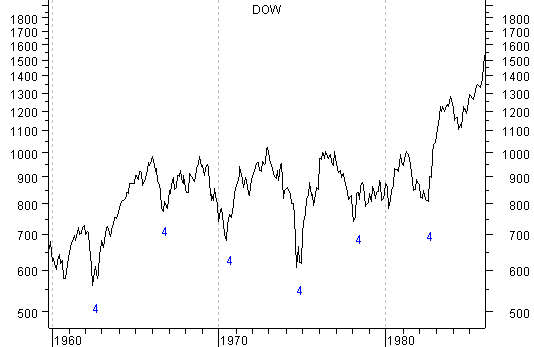
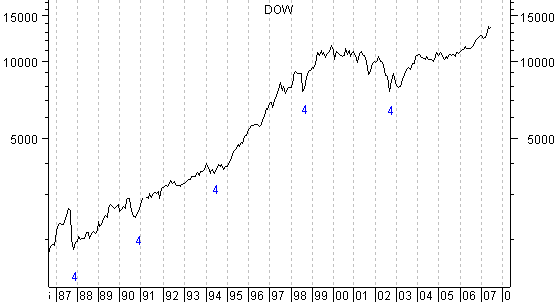
The charts below have appeared in many of my articles on the 4-year cycle, but I'm using them here again because they do provide black and white proof of the ebb and flow and the none static nature of the 4-year cycle that has existed in the stock market since the inception of the Dow Jones Industrials in 1896. You have been warned!
I have begun doing free Friday market commentary that is available to everyone at www.cyclesman.com/Articles.htm so please begin joining me there. Should you be interested in analysis that provides intermediate-term turn points utilizing the Cycle Turn Indicator on stock market, the dollar, bonds, gold, silver, oil, gasoline, the XAU and more, then please visit www.cyclesman.com for more details. A subscription includes access to the monthly issues of Cycles News & Views covering the Dow theory, and very detailed statistical based analysis plus updates 3 times a week
By Tim Wood
Cyclesman.com
© 2007 Cycles News & Views; All Rights Reserved
Tim Wood specialises in Dow Theory and Cycles Analysis - Should you be interested in analysis that provides intermediate-term turn points utilizing the Cycle Turn Indicator as well as coverage on the Dow theory, other price quantification methods and all the statistical data surrounding the 4-year cycle, then please visit www.cyclesman.com for more details. A subscription includes access to the monthly issues of Cycles News & Views covering the stock market, the dollar, bonds and gold. I also cover other areas of interest at important turn points such as gasoline, oil, silver, the XAU and recently I have even covered corn. I also provide updates 3 times a week plus additional weekend updates on the Cycle Turn Indicator on most all areas of concern. I also give specific expectations for turn points of the short, intermediate and longer-term cycles based on historical quantification.
Tim Wood Archive |
© 2005-2022 http://www.MarketOracle.co.uk - The Market Oracle is a FREE Daily Financial Markets Analysis & Forecasting online publication.