UK Interest Rate Forecast 2010 and 2011
News_Letter / UK Interest Rates Jan 24, 2010 - 12:03 AM GMTBy: NewsLetter
 The Market Oracle Newsletter
January 13th, 2010 Issue #3 Vol. 4
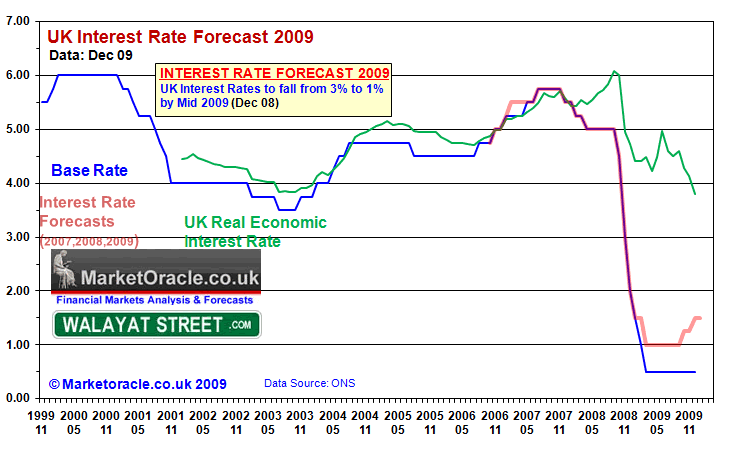
UK Interest Rate Forecast 2010 and 2011Dear Reader The British Economy as with other developed economies entered 2009 in recession and on the brink of Depression which triggered a series of panic interest rate cuts all the way to 0.5% by March 2009 and they have stayed there right into the start of 2010. This in-depth analysis is third in a series of analysis that seeks to generate accurate forecasts for UK Inflation, GDP Growth and Interest Rates for 2010 and beyond. The whole analysis and implications of which will be published as an ebook that I will make available for FREE, ensure you are subscribed to my always free newsletter to get the completed scenario in your email in-box. UK Interest Rates Forecast 2009 Recap The analysis of December 2008 forecast (UK interest rate forecast of early December 2008) for 2009 that UK interest rates should decline to 1% (from 3%) by early 2009 and remain there into the second half of 2009. The UK base interest rate was cut to 0.5% in March 2009, following which the Bank of England has continued to pursue an artificial banking system by keeping interest rates at an extreme historic low of just 0.5% into the end of 2009 so as to flood the bankrupt banks with liquidity to enable them to rebuild their balance sheets by overcharging customers against the base interest rate and manipulated interbank market rate of 0.66% against rising real market interest rates which have been in a steady climb since March 2009 which increasingly has meant that during 2009 the base interest rate had become irrelevant to the retail market place.
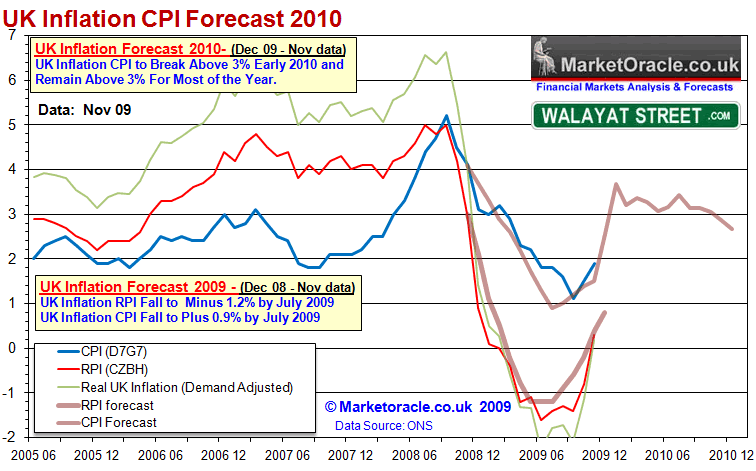
The forecast for most of 2009 showed a positive bias of 0.5%, rising to 1% by year end against the actual UK base rate. UK CPI Inflation Analysis and Forecast for 2010 The in-depth analysis and forecast conclusion for UK inflation for 2010 (http://www.marketoracle.co.uk/Article16085.html) included the following analysis points and conclusion that built towards the forecast for UK GDP Growth and Interest rates for 2010 and beyond, therefore these analysis points are not being repeated in this article.
Conclusion and UK CPI Inflation Forecast 2010 The sum of the above and recent analysis is for UK inflation to spike higher in the coming months during early 2010. This is inline with my view that the Labour government has succeeded in sparking a strong debt fuelled economic recovery that will become clearly visible during the first quarter of 2010. I expect UK inflation as measured by CPI to break above the Bank of England's upper CPI target of 3% very early in the year, and stay above 3% for most of the year only coming back below 3% late 2010 as a consequence of the next governments attempts to bring the unsustainable budget deficit under control.
Higher inflation implies higher interest rates, especially as the CPI rate is expected to break above 3% early 2010, which means market interest rates will continue to trend higher even if the Bank of England continues to keep the the base interest rate fixed at 0.5% at least into the General Election. However the 0.5% interest rate policy is not sustainable under the weight of persistently high inflation (above the BoE's 3% upper limit) and therefore the pressure for the base interest rate to rise will become intense during 2010. UK Economy GDP Growth Forecast 2010 and 2011, The Stealth Election Boom The in-depth analysis and forecast conclusion for UK Economic Growth for 2010 and beyond(http://www.marketoracle.co.uk/Article16167.html) included the following analysis points and conclusion that build towards the forecast for UK Interest rates for 2010, therefore these analysis points are not being repeated in this article.
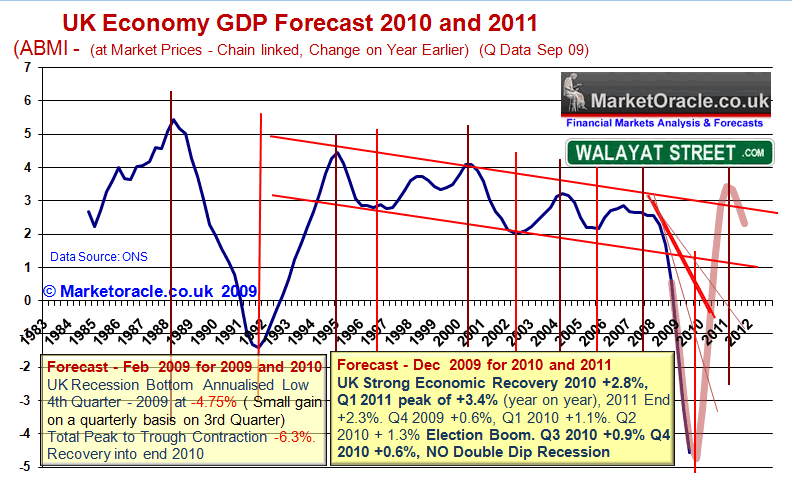
UK GDP Growth Forecast Conclusion The sum of the above analysis is for a strong economic recovery into the end of 2010 which given the pessimism today I term as the Stealth Election Boom that followed the Stealth Bull Market of 2009, the economic 'boom' will continue in to a peak in Q1 2011, which will be followed by weakness during 2012 and 2013 and strong recovery for 2014, and into a 2015 summer general election, breaking this trend down into GDP terms for end 2010 +2.8%, 2011 +2.3%, and taking account of the election cycle preliminary GDP projections for 2012 of +1.1%, 2013 +1.4%. 2014 + 3.1% with expectation of strong Q1 growth for 2015. Therefore I just cannot see this double dip recession that the mainstream press and so called think tanks are obsessing over at this point in time, no year on year economic contraction or even a quarter on quarter dip is visible. The following graph illustrates my trend forecast for quarterly GDP growth over the next 2 years 2010 and 2011.
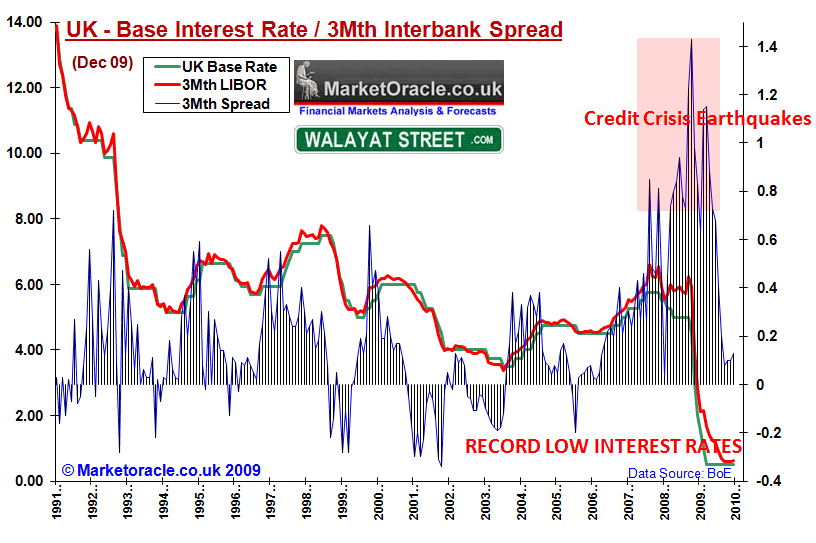
UK Strong Economic Recovery 2010 +2.8%, Q1 2011 peak of +3.4% (year on year), 2011 End +2.3%. Q4 2009 +0.6%, Q1 2010 +1.1%. Q2 2010 + 1.3% Election Boom. Q3 2010 +0.9% Q4 2010 +0.6%, NO Double Dip Recession, NO Negative Quarters for 2010 or 2011.. If the anticipated strong economic recovery starts to materialise during 2010, then the Bank of England will view its continuing policy of keeping interest rates at 0.5% as erroneous and should start to lift interest rates rapidly to levels far above today's consensus view emanating out of the mainstream press that UK interest rates will be kept at 0.5% for not just 2010 but possible several more years beyond. Above trend growth of 2.8% by the end of 2010 does NOT imply an interest rate of 0.5%. This suggests a series of rises during the year, so whilst the first half of 2010 my appear benign in interest terms the second half could prove a rate shocker, which is suggestive of a a rate in the region of at least 3%. LIBOR / Base Interest Rate Spread Analysis The below graph shows the spread between 3 Month LIBOR and the UK Base Interest rate.
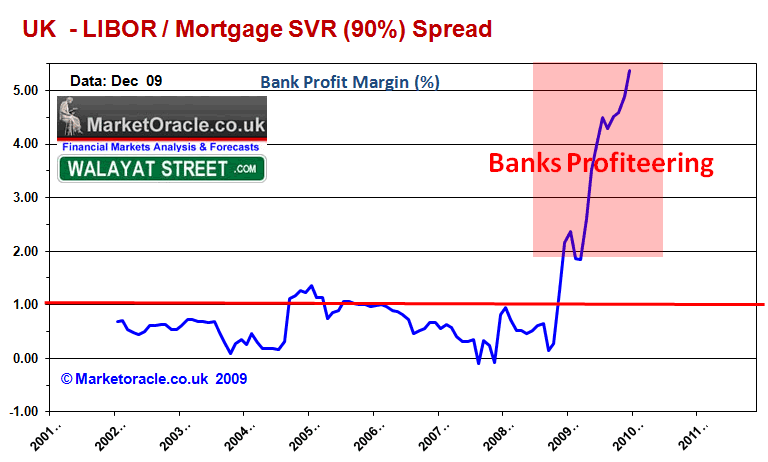
The above graph illustrates that the credit crisis did not just appear out of the blue in September / October 2008 but began over a year earlier in August 2007 when the interbank money markets froze as a consequence of the fictitious mark to market valuations on sliced and diced collaterised debt obligations that the banks had accumulated. Whilst the central banks attempted to unfreeze the credit markets through a number of increasingly desperate actions during the subsequent 12 months however all of these measures failed which resulted in a series of credit crisis earthquakes culminating in the September 08 Lehman's bust which galvanised governments and central banks to literally throw everything they had to bring the inter bank interest rates down, which in the UK included cutting the base interest rate to virtually zero and pressing the monetary nuclear button of printing money and forcing the tax payers to guarantee more than £1 trillion of bad bank debt which has resulted in bringing the base rate / LIBOR spread down to within historic norms, but at huge cost to bank customers including borrowers and savers as the following illustrates. Banks Profiteering From Artificial Banking System The artificial banking system means that the bill for rebuilding the bank balance sheets (and bonuses) is being paid by Borrowers and Savers who along with all tax payers are being forced to pay for the bankster's crimes as tax payer bailed out banks such as HBOS pay a pittance on instant access savings accounts of as little as 0.1% against a requirement of 2.3% just to cover CPI inflation of 1.9% plus the 20% tax charged on interest whilst at the same time upping the rate on borrowers far beyond the illusion of low interest rates as presented by a base rate of 0.5% as the following graph illustrates the spread between the mortgage standard variable rate and interbank market rate resulting in a huge profit margin for the banks.
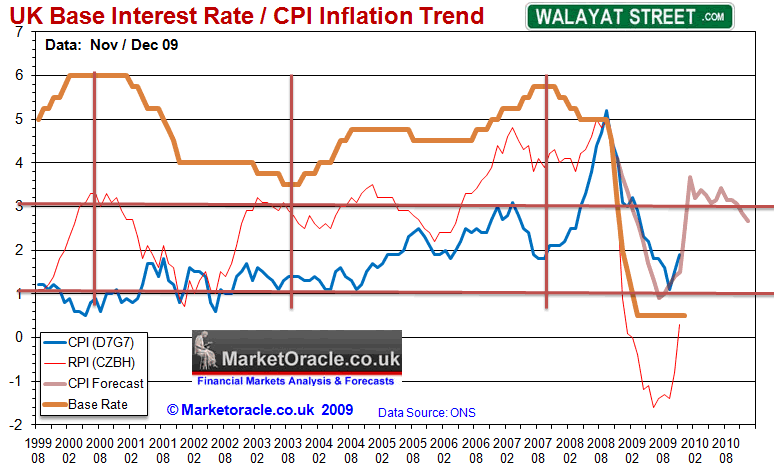
Money is being sucked out of the pockets of borrowers and savers and being deposited onto the balance sheet of bailed out banks that have no incentive to pay a decent rate of interest on savings when they can borrow at 0.5% from the Bank of England and marginally higher from other banks. The artificial banking system is resulting in unprecedented huge profits margins for the banks as market interest rates charged to retail borrowers continues to rise regardless of the base rate being held at 0.5% into 2010. The big question is when will the Bank of England start to reduce this unprecedented artificial support for the UK banks. The marginal up tick in the LIBOR spread suggests that this is now underway to a small degree. However we are talking about a minute movement. The key indicator for a series of increases in interest rates will be when the spread rises to above 0.3 from the current 0.13, which considering the first graph suggests that this is not on the immediate horizon and therefore implies that we are still some months away from the first rate rise i.e. the trend is suggestive of no rate rise during the first half of 2010. Do UK Interest Rates Lead or Lag CPI Inflation? One of the Bank of England's primary objectives is to target UK inflation at CPI 2% in 2 years time and stay within a range of 1% and 3% through the use of monetary policy with the primary tool being interest rates. The consensus view is that when inflation is expected to rise then the Bank of England raises interest rates, and where the Bank of England expects inflation to fall towards its lower band then it lowers interest rates so as to boost economic activity and hence inflation. Therefore the purpose of this analysis is to confirm the role inflation plays in determining the Bank of England's primary objective of managing inflation and what it suggests for interest rates during 2010. The below graph includes the Inflation forecast for 2010 as of December 2009 which projects towards a sustained trend to above 3% which on face value would imply the Bank of England should start raising interest rates.
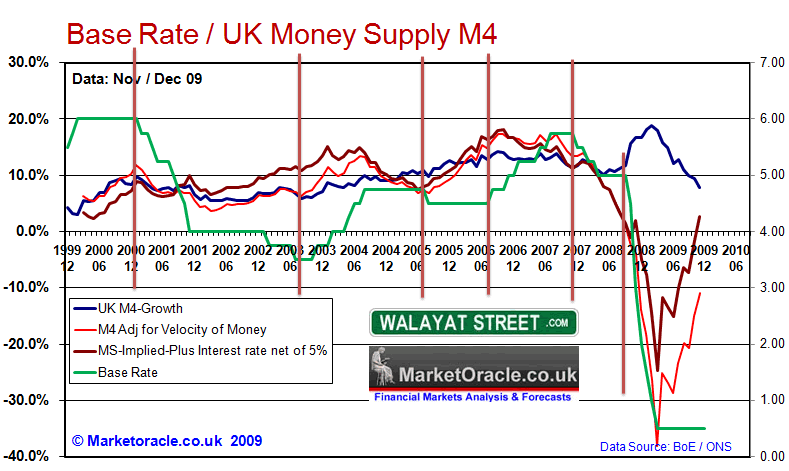
The above graph implies that the Bank of England tends to react late to changing inflation and then continues the interest rate trend too far in the opposite direction which implies ever increasing volatility in the series. Given the already completed inflation forecast this implies that the Bank of England will respond much later than expected to rising inflation, though when it does respond it will continue raising interest rates even after inflation turns lower, which is suggestive of interest rates rising from mid 2010 and continuing into mid 2011,with smaller initial steps of 0.25%, throughout the proposed 12 month forecast cycle. UK interest Rates and M4 Money Supply Relationship The below graph shows UK M4 Money Supply and Money Supply adjusted for the velocity of money that takes into account the state of the UK economy i.e. an booming economy has a higher velocity of money and hence money supply has a more inflationary impact than an economy in recession where high headline money supply in reality is masking deflation rather than inflation as we saw during 2009.
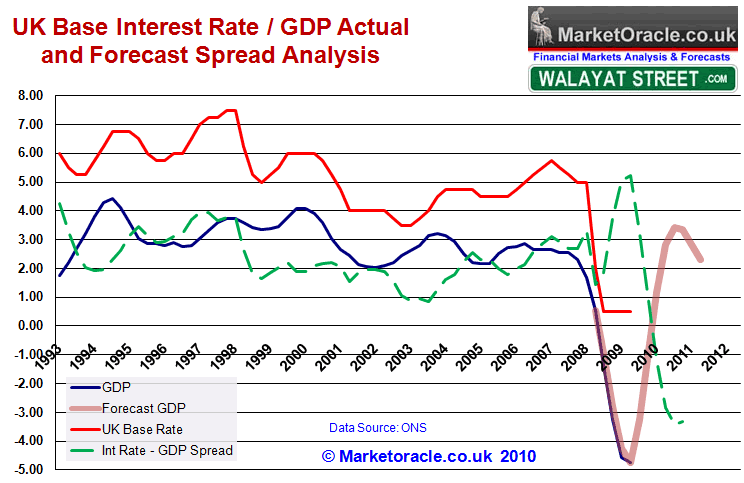
The above graph shows some relationship between interest rates and the money supply adjusted for the velocity of money (red) in that when the M4 Adjusted is below 10% the Bank of England cuts interest rates and when it is above 10% the Bank of England raises interest rates. The graph shows the consequences of extreme deflation into early 2009 which was followed by the unprecedented near panic interest rate cuts to 0.5%. The subsequent trend is resulting in a fast M4 recovery though which at this point remains negative, however the projected trend can be seen reaching the 10% level by mid 2010 and therefore implies UK interest rates may be held at 0.5% until mid 2010 before interest rates are gradually raised as long as M4 Adjusted remains above 10%. This also suggests should Adjusted M4 continue to accelerate well above 10% then the pace of rate rises could escalate further i.e. in 0.5% jumps. UK Interest Rates and GDP Growth Trend Relationship The below graph shows UK Interest rates against annual GDP as well as the spread between the two. Also included is the current forecast trend for UK GDP growth for 2010 and 2011.
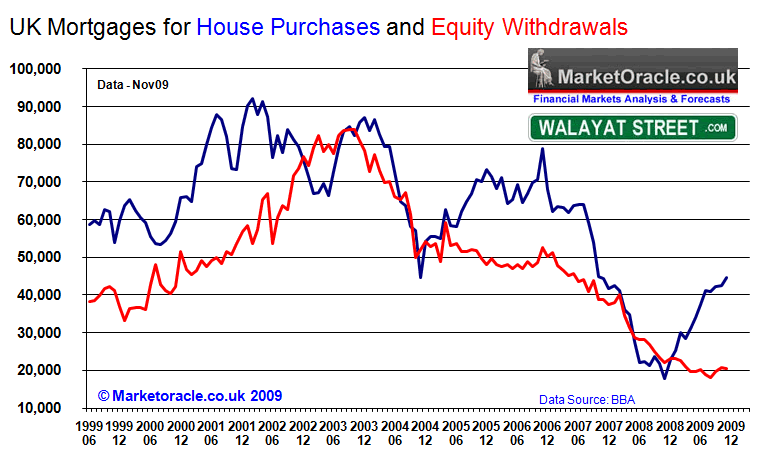
The above graph shows an average interest rate spread against annual GDP of 2%, with a wider range of 4% to 1% i.e. UK interest rates are normally expected to be 2% above GDP. The current spread as of Q4 estimate of -4.73% is at 5.25% which illustrates why the Bank of England embarked upon Quantitative Easing aka money printing in March 2009 as interest rates of 0.5% had little impact on the actual economy at the time due to the degree of economic contraction under way. However taking the strong forecast GDP growth into account that projects to +2.8% for 2010 and +2.3% for 2011, then the current base interest rate of 0.5% will result in a swift plunge in the real economic interest rate to far below the trend of 2% and the low of 1%, which therefore suggests that the UK interest rate by the end of 2010 would be targeting 4% to stay within this range and rise to 4.5% by mid 2011. Off course this is dependant upon the strong GDP forecast growth of +2.8% actually transpiring, nevertheless this analysis does suggest that even a mild recovery of below trend to +1.5% would still target an interest rate of at least 2%, therefore this analysis is suggestive of an end 2010 interest rate range of between 2% and 4%. UK Quantitative Easing Money Printing to Hit £275 Billion 2010 The Bank of England cut UK interest to a historic low of 0.5% in March 2009 for the objective of boosting the economy so as to enable it to SELL government bonds, however this did not work as bond auctions started to FAIL in March, which therefore triggered the Bank of England to hit the panic button, igniting Quantitative Easing or Quantitative Inflation, having received the green light from the Government a few months earlier. The initial print run was for £75 billion which has been steadily extended to £200 billion to date. Nine months on the phrase Quantitative Easing is bandied about in the press as though it is normal, however I cannot emphasis enough how big an event Quantitative Easing aka Money Printing is, QE is the biggest monetary event in the Bank of England's 315 year history, as once ignited it is difficult to wean an economy off of QE as Governments fail to control the budget deficits that become endemic which demands a continuance of Q.E. and therefore risks igniting Quantitative Inflation and currency / market panics. QE Huge Boost to GDP I have received a few emails critical of my strong UK growth forecast for 2010 of +2.8%, mostly from those that expect / hope for a double dip recession that would allow them a second opportunity to buy into the stocks bull market at near the bear market lows having missed the birth of the stocks stealth bull market last March, in that light the following may enlighten readers on the huge boost to GDP during the past 9 months: Whilst approx £190 billion of the £200 billion of QE authorised to date has been deployed over the past 9 months. However the true implication of QE on the economy can be better appreciated when setting it against the recession that has seen a contraction of some 6.2%, as QE of £180 to £200 billion is equivalent to GDP of 14% to 16% i.e. far greater than the loss of GDP during the 15 month recession, and not forgetting that QE is just one part of the programme of huge Government deficit spending (14% of GDP) and near ZERO interest rates (Savers subsidised bailouts) and the over £1 trillion of bailed out banks bad debt liabilities, then direct capital injections of over £80 billion (6% of GDP) illustrates the extreme lengths to which the authorities have gone to, to bring the recession to a halt, which sows the seeds for above trend growth during 2010. The Bank of England's Route towards £200 billion QE The Bank of England embarked upon a programme of printing money or Quantitative Easing during March 2009 with an initial print run of £75 billion of a total set at £150 billion in an attempt to wave the central bank magic wand to increase the supply of credit. However as I warned at the time (5th March 2009: Bank of England Ignites Quantitative Inflation) that once started the Bank of England would continue printing money right into the May 2010 General Election targeting an print run of as much as £450 billion and therefore igniting Quantitative Inflation during 2010. Virtually all of the mainstream press swallowed the Bank of England's hints and winks that Quantitative Easing had ended at £125 billion during the summer months, which at the time I stated was not possible (8th July 2009: Irrelevant UK Base Interest Rate on Hold as Real Rates have Already Begun to Rise) This confirms my view that the Bank of England will continue printing money into year end to beyond the current arrangement of £150 billion and probably as high as £250 billion. I projected a Quantitative Easing total towards £250 billion by the end of 2009 with the actual total of £200 billion of money printed as a direct consequence of the Labour Government's objective of both aiming to maximise the number of seats retained at the next General Election as well as to deliver a scorched earth economy to the next Conservative Government. Therefore the Labour Government also wins because it gets to hide this Quantitative Easing debt as theoretically purchases and sales cancel each other out in the fantasy land of central banking accounting and feeble government auditing. I.e. by magic approx £200 billion of new government debt has vanished into thin air, for if had not been hidden under the carpet then UK Gilt interest rates would be much higher due to the increase in supply of approx 33%. Asset Price Implications of the Potential End of Q.E. Quantitative Easing being brought to an halt / unwinding of purchases would hit asset prices hard, i.e. we would see the Gilt bond market impacted as instead of purchasing 'most' of the government bonds the Bank of England would become its biggest seller with a lot of supply overhanging the market this would send the bond market into a tailspin which would follow into the stock market that has soared in good part as a consequence of Q.E., similarly the bounce in UK house prices would soon evaporate. This suggests whilst the BoE talks of ending Q.E. I just don't see it happening whilst the Government runs a budget deficit anywhere near as large as 15% even half of this would not be enough to end Q.E. So it looks like Q.E. will be here for many years as I originally voiced before Q.E. began. However as the asset markets stabilise at higher levels, the Bank of England rather than printing new money may entice banks and financial institutions to purchase bonds rather than further drive up stocks which is therefore suggestive of a tough year for other asset prices. Bank of England Forcing Banks to Buy Gilts The official line of QE was to boost bank lending, however Q.E. is apparently having the opposite effect at the commercial banks as the Bank of England's twin objectives of monetizing government debt and for the the bankrupt banks to improve their balance sheets is in effect forcing the banks to BUY government bonds as Gilts are seen as the safest asset class and therefore boosts the Banking sectors credit worthiness in terms of capital ratios so instead of lending tax payer money loaned to the banks, the banks are using tax payer money to buy government bonds and on short-term deposit at the Bank of England. Surely this must be by design as the Bank of England's primary purpose is for the orderly management of the Government debt market hence this is ensuring the maximum demand for a huge amount of debt issuance estimated at £225 billion for the current financial year, which includes new debt and maturing debt rolled over. Continuing Budget Deficits for Several Years Even if the next government manages to implement significant policy measures to cut the annual deficit by £80 billion year to approx £100 billion by means of tax rises, spending cuts and revenue from growth, against the Labour governments target of £162 billion. A deficit of £100 billion would still equate to about 8% of GDP, so would still require more money printing to monetize government debt of which approx £60-£70 billion would need to be monetized. Bank of England Blaming Government, Seeking Greater Powers From Conservative Government Governor of the Bank of England has been ever more vocal during 2009 in his criticism of the governments policy of only cutting the huge deficit over the next 5 years by half as clearly this is not a sustainable policy. However whilst Mervyn King is busy blaming others he needs to take a long hard look in the mirror at his own failure both before the crisis broke and right into the present day. The Bank of England has consistently shown itself to be an incompetent institution that tends to act too late to respond to both inflation and economic concerns which has directly contributed to the depth of the 2009 crisis. The truth of the matter is that had the Bank of England sat twiddling its thumbs during 2008 by keeping interest rates at 5% for far too long whilst the economy burned which pushed the economy over the edge of the cliff. The MPC committee is generally populated by clueless academics that collectively usually result in an overly cautious wait and see attitude, by which time it is generally too late! Also I should remind readers that interest rates were only cut in early October 08 when the Prime Minister effectively seized control of monetary policy by forcing the Bank of England to start cutting rates as illustrated by the first cut of 0.5% which was announced on October 8th 2008 by Gordon Brown himself from the Prime Ministers dispatch box in the House of Commons rather than by the Bank of England. Mervyn Kings continuing criticism is even more outrageous in the run up to General Election as clearly his party political outbursts electorally favour the Conservatives, probably helped by George Osbourne's recent comments that he would transfer even more powers to the Bank of England despite the fact that it consistently fails in its primary government set objective of keeping Inflation at 2%, as we will again repeatedly witness during 2010. Though the FSA charged with regulating the banks has been even less competent which despite knowing as a fact that banks such as Northern Rock and HBOS were lending 100% mortgages financed from short-term money market borrowings which resulted in an extremely high risk institutions, but the FSA FAILED to regulate the banks for several years in the run up to the August 2007 credit crisis and beyond. QE is Just More Bankster Fraud Were told by the politicians and the Bank of England that money printing is to boost the UK economy, NO the primary purpose of money printing is to enable the banks to generate huge profits to rebuild their balance sheets, which they are doing. If the government wanted to boost the economy rather than banks profits then the government should have taken the £200 billion printed and given it to the 29 million or so of tax payers which would have resulted in a huge cash for consumption windfall of nearly £7000 per tax payer ! Now that WOULD have immediately boosted the economy ! Imagine 29 million people receiving a cheque for £7,000 each, imagine the resulting consumption boom that would take place. So the FACTS are that the £200 billion is for the purpose of bankster's to profit from then to boost the economy, which is what one would expect the BANK of England to do ! i.e. to support its brethren bankster's then to consider the debt slave tax payers that are being forced to bail the bankster's out. QE Money Printing 2010 Conclusion QE will continue during 2010 until the Bank of England is sure that a. their brethren bailed out banks no longer risk financial armageddon, and b. That government debt issuance does not risk a Gilt bond market collapse. My original estimate was for QE to rise to £450 billion over the next 5 years (from 2009), therefore I expect we will pass the half way point during 2010 as I expect the Bank of England keep printing printing money for several more years. The Bank of England's December 09 announcement that it would now buy and sell corporate paper to me suggests that the Bank is considering selling what little of corporate paper it has bought during the past 9 months in favour of supporting the Gilt bond market. Therefore I expect this coupled with further incentives for banks to buy gilts means much less QE during 2010 than 2009, which suggests a target total for 2010 of £275 billion, whilst at present academic economists and mainstream press suggest that there would be no further Q.E. beyond £200 billion and even that the Bank will seek to unwind QE during 2010 i.e. Bank set to close the £200bn printing press - Independant 8th Jan 10 The Bank of England's £200bn quantitative easing (QE) experiment is set to come to an end next month, with the Monetary Policy Committee (MPC) yesterday voting to leave the scale of the scheme on hold. The remaining money in the programme will be exhausted by the time of the MPC's February meeting and it is then expected – barring shocks – to take the economy off its life support system. Though the mainstream press said basically the same thing last July when Q.E. was at £125 billion, as mentioned earlier. Money Printing Theft of the Value From Holders of Existing Currency Quantitative Easing is not a free lunch, the price of which is being paid by savers as the supply of money increases so does it decrease the value of all currency, this is most clearly evident by two indices, 1. Sterling exchange rate against other currencies, though all currencies are engaged in competitive devaluation so therefore probably something like gold is a better indicator in this case 2009 saw a devaluation of about 20% with more to come during 2010. 2. The inflation indices of which the Consumer Price Index is the governments preferred measure. Throughout 2009 and into 2010 we have seen the base interest rate BELOW the rate of CPI inflation which means NEGATIVE real interest rates i.e. your rate of interest is below the rate of inflation. This means that the bill for low / negative interest rates is being paid by Savers who along with all tax payers are being forced to pay for the bankster's crimes as tax payer bailed out banks such as HBOS pay a pittance on instant access savings accounts of as little as 0.1% against a requirement of 2.3% just to cover CPI inflation of 1.9% plus the 20% tax charged on interest. Implications for Interest Rates The Bank of England is likely to be reluctant to raise interest rates whilst Q.E. continues. Which therefore suggests rates will only rise when the Bank of England is forced to raise rates by the markets as a consequence of risks of bond purchases. Which suggests 2010 is going to be a difficult year to forecast interest rates. Improving UK Mortgage Lending Feeding the House Prices Bounce The below graph shows UK Mortgage lending for House Purchases and Equity Withdrawals
The Government and Bank of England have succeeded in their primary objective of increasing both the supply of mortgages and lowering the interest rate burden on borrowers so as to bring the UK house price crash to a halt, which suggests that in terms of supply, the credit markets are starting to return to a LOW NORMAL state.
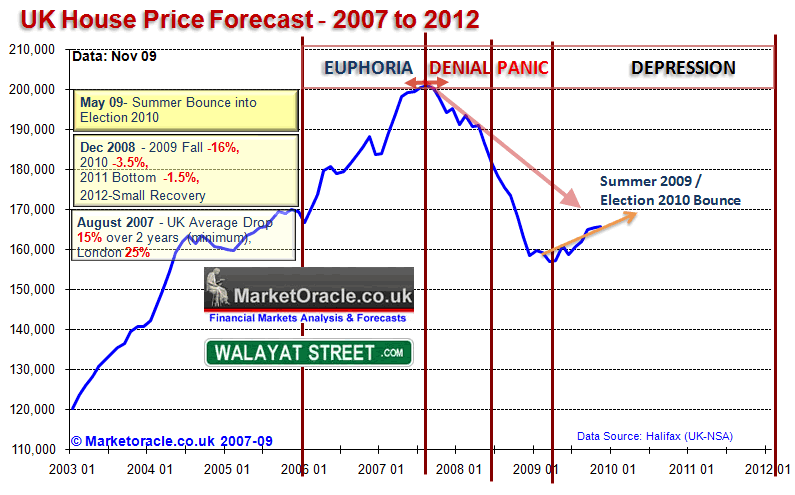
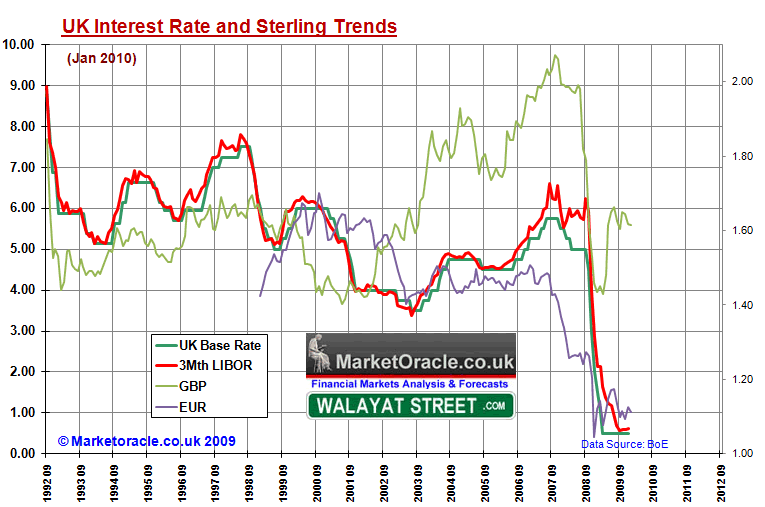
UK house prices have now risen by nearly 10% from the March lows as a consequence of unprecedented measures such as near zero base interest rate, mortgage banks arm twisting to limit repossessions and £200 billion of money printing. All of which leave the governments coffers empty and the Bank of England with little ammo to fire at future crisis which therefore suggests that the Bank of England should start to focus in the near term to tepidly begin to unwind the ultra loose monetary policy by starting to gradually raise interest rates though without wanting to unravel the work done so far in stabilising the banking system which therefore is suggestive of small steps spread out rate increases as the Bank of England adopts a cautious wait and watch attitude for any negative impact before each subsequent rate rise. British Pound Trends and Interest Rates The below graph shows the UK base rate and sterling trends against the U.S. Dollar and Euro to test the widely held hypothesis that Rising UK interest rates results in a rise in the exchange rate and conversely cuts in UK interest rates results in a fall in sterling.
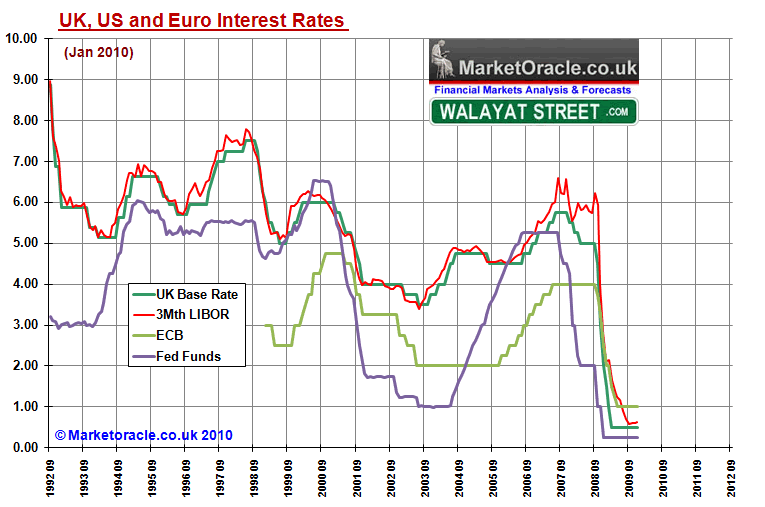
The Pound / Dollar trend suggests that GBP tends to lead UK interest rates i.e. sterling has a tendency to rise against the Dollar ahead of UK interest rate hikes and a tendency to fall against the Dollar ahead of UK interest rate cuts. The most recent price action has seen sterling rally from £/$1.40 in early 2009 to above £/$1.60 as of the present which therefore implies that the currency markets are discounting future interest rate hikes. The Pound / Euro trend suggests that the objective is aimed towards a stable exchange rate against the Euro i.e. less volatile hence interest rates are used in an attempt to limit fluctuations as we saw between 1999 and 2007, as when the £/Euro rate was high at 1.60, interest rates were cut, and when the £/Euro was below the floor of about 1.40 then interest rates had been steadily increased so as to maintain the 1.40 floor. This is part of the Bank of England's objective of ensuring price stability by tracking the Euro. However during 2008 and 2009 we saw a crash in sterling that traded below 1.10 to near parity with the Euro as the Bank of England abandoned everything in the interests of preventing financial and economic armageddon. However as the banking system has gradually stabilised it is highly likely that Bank of England focus will again shift towards price stability which means keeping sterling with an range against the Euro. The £/Euro has managed to trend higher from near parity 12 months ago to today stand at 1.10. This is suggestive of a higher range then seen over the past 12 months i.e. a probable wide target range of between 1.10 to 1.30 against the Euro, therefore the current rate is at the floor which suggests a rise towards the target mid range of 1.20 which on face value suggests further downside trend is limited and more than likely that the Pound will rise against the Euro towards 1.20, which therefore suggests UK interest rates should be relatively higher than the ECB interest rate to reinforce this trading range. In summary, the sterling trend is suggestive of the Bank of England targeting a £/Euro trading range of between 1.10 and 1.30, which is therefore suggestive of relatively higher UK interest rates against the Euro-zones which my next analysis will look at. UK, U.S. and Euro Interest Rate Trends Analysis The below graph shows the key interest rates for the U.K., U.S. and E.U. so as to determine any advance trend change signals for UK base interest rates during 2010.
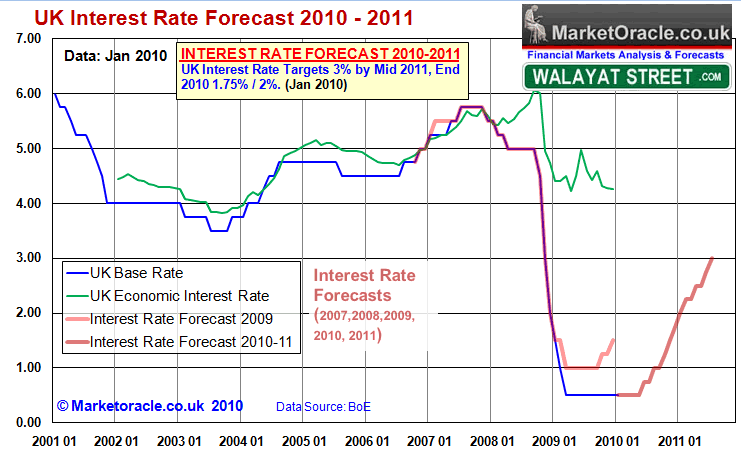
Fed Funds - The above graph clearly shows that the U.S. Fed Funds rate usually acts as a leading indicator for U.K. interest rates both in terms of timing and in terms of trend. The current trend shows no sign of an imminent increase in the Fed Funds rate and therefore implies a UK base interest rate increase is not imminent either. ECB - The European key interest rate trend shows a less volatile dataset then either that for the U.K. and U.S. which suggests a more cautious response to economic events, this is borne out by the tendency for European interest rate trend changes to lag both the U.S. and U.K. and therefore not particularly useful in signaling UK interest rate trend changes. However European interest rates are usually significantly below that of the UK interest rate due to less perceived risk, with a normal UK rate usually at least 1% above the European rate therefore at present would indicate a interest rate of 2% as a minimum. Summary, U.S. Rate changes tend to lead UK rate changes, with UK rates usually at least at a 1% premium to either European or U.S. rates which therefore illustrates the current state of an artificial heavily subsidised banking system with no sign visible that the central banks are willing to return to a normal market at this point in time and therefore implying that the first UK interest rate hike still remains some way off. UK Interest Rate Forecast 2010 - 2011 ConclusionThe difficulty in arriving at an interest rate forecast conclusion for 2010 is that we have a heavily supported artificial banking system for the primary purpose of the near unlimited bailout of the banking sector. The problem in arriving at the forecast is that I need to look beyond economic indicators and put myself into the mindset of the scared officials at the helm of the Bank of England, who having tasted financial and economic armageddon are now so terrified by what they saw that they would rather continue to support the bankrupt banking sector for far too long and thereby allowing the bankster's to continue effectively stealing billions of tax payer cash as 'bonuses' and also allow price inflation to let rip as a consequence of printing money. But against this petrified Bank of England reluctant to do anything that may risk a return to financial armageddon we have the market in the wake of a flood of government debt issuance that despite ever increasing quantitative easing demands higher interest rates, otherwise the Bank of England risks Gilt Auction failures which could trigger a sterling crisis during 2010. So it is both a tough balancing act for the Bank of England and a tough call for anyone to attempt to forecast UK interest rates for 2010. So why forecast if it's so difficult this year ? Well, because finance and investing IS all about forecasting the future, perhaps if the bankster's had registered this fact then they would not have been caught up in generating short-term fictitious profit reports to bank huge bonuses, when at the end of the day today's decisions should boil down into what one thinks is a probable future outcome so as to allow investment decisions to be made in the present. The primary message from my accumulative analysis of inflation, economy and in this article is that the Bank of England WANTS to swim in the warm waters of Inflation after the deep freeze of Deflation, which strongly implies that the Bank of England will IGNORE soaring inflation early 2010 and instead DELAY raising interest rates until it sees actual evidence of a strong economic sustained recovery which my analysis suggests should transpire during the first half of 2010. Therefore the BoE will be focused on the quarterly GDP data, first Q1 to be released at the end of April 2010 and then Q2 to be released late July 2010. Which means that there is a high probability that the first rate rise may not materialise until August 2010. After which rates will be increased not in line with inflation but in line with improving GDP and other indicators of economic activity into the end of 2010. As a final conclusion, I expect a presently petrified Bank of England to be gradually forced by the market to start raising the UK Base interest rate in small steps of 0.25%, with the first rate rise probably coming just before release of Q2 GDP Data (July) in June 2010 i.e. after the next election deadline and then followed in August and September 2010 on further indicators of improving economic activity. My concluding target is 3% by mid 2011, the difficulty is in saying where rates will be at the end of 2010 as the range is 1.5% to 2%. UK Interest Rates Forecast 2010-11: UK interest Rates to Start Rising From Mid 2010 and Continue into end of 2010 to Target 1.75% / 2%, Continue Higher into Mid 2011 to Target 3%.
Interest Rate Forecast Implication The full implications of all three in depth analysis and forecasts for UK inflation, economy and interest rates will follow in the inflation mega-trend ebook to be completed over the coming week which I am making available for free. Ensure you are subscribed to my always free newsletter get this in your email in-box. Election - The Deadline for the next election is June 3rd, therefore even if Gordon Brown decides to cling onto power until the very last minute then there will still be no rate rise in the lead up to the next election. The most probable date for the next election remains May 2010 as the economy 'should' be showing clear signs of a strong recovery by then, despite negative impact of tax hikes. My original projection as per the UK election forecast of June 2009 remains that projects the Conservatives on 343 seats, Labour 225 and Lib Dems on 40. Although the people of Britain got a window into who really owns and runs the country as the Government literally risked unlimited liabilities for the tax payers to bailout the bankster's who instead of being charged with the fraud of the century are again be rewarded with billions in bonuses which is in fact tax payers cash funneled into their back pockets. Labour has shown itself to be no different then the Conservatives when it comes to being in the back pockets of the bankster elite. Borrowers Firstly do not forget that the primary purpose of the banking sector is to turn everyone (including governments) into debt slaves. So the first objective is for people implement a plan to FREE themselves from DEBT SLAVERY. The artificial banking system is currently running on a huge profit margin which means borrowers are paying through the nose despite a 0.5% base interest rate and 0.63% interbank rate i.e. borrowers are paying many multiple of times in excess of the rates banks borrow at, from mortgages with SVR's hovering around 6%, to personal loans of 10% to 15% to credit cards of 20%+, which are generating huge profits for the tax payer bailed out banks supposedly for the purpose for the banks to rebuild their balance sheets but as we are again witnessing is in significant part being pocketed by bankster's as bonuses for profits that ONLY exist because of the tax payer cash. So given the fact that the banks are already running on huge profit margins, therefore I do not see much change for most borrowers rates during the year as the interest rates charged are already excessively high which effectively discount a much higher base interest rate north of 4%, which means there is plenty of scope for borrowing rates to actually fall during the year rather than to rise. Mortgages - Over 90% of people can only get on housing ladder with a mortgage, therefore the prime consideration for borrowers is in able to service the loan, in this regard the long standing but often broken rule of not borrowing more than X3.5 salaries should be at the forefront of ones mind. This rule is not to prevent you from buying a bigger house, but to prevent you LOSING your current house. That coupled with a minimum deposit of 25% should say one is able to buy. If someone only has a 5% deposit or not enough income then to be blunt you should NOT consider buying a house. I will cover the UK housing market in depth in my next ebook. I expect mortgage interest rates to be little changed for most borrowers. However those that are the most desirable customers in terms of credit risk are likely to see the rates on the best products rise marginally. Pay Day Loans - During the recession many pay day loan outfits have sprung up that offer to fill the gap between each pay cheque with near instant small loans of upto £1000 that borrowers are further enticed to roll over into the pay day. To be blunt, if you are considering these types of loans then you might as well put a gun to your head! for all of the distress they will eventually cause you. Whilst the base rate is at 0.5%, pay day loan outfits are charging over 2,000% APR. These types of loans should be illegal in Britain but they are not, which just goes to show either how inept the financial regulator is or culpable in allowing ordinary citizens to fall victim to 'legal' loan sharks. If the FSA had the best interests of the general public at heart then it would lobby the government to introduce legislation to CAP ALL interest rates at base rate plus 10%. Yes it would mean that the financially illiterate presently taking on extremely high a risk loans would usually be denied loans due to the risk / reward factor, but that is how it should be. Savers After the wipeout of 2009 when savers subsidised the bailout of the banking sector through ultra low interest rates of as low as 0.1%, 2010 should see some decent recovery in nominal rates and hopefully in real rates of interest as well (after inflation). The best variable rates are usually 1% to 1.5% above the base rate. Fixed rates demand a premium of approx 2 to 3% depending on the term fixed. So by the end of 2010, this is suggestive of a variable rate in the region of 2.75% to 3.5% and fixed rates of between 4% to 5%, which should BEFORE the first interest rate hike as market competition will move ahead of the curve to discount future interest rates mid year. This suggests savers are probably better off NOT fixing now in advance of rising market savings rates by the time of the first base rate hike. Foreign Banks Offering Higher Rates - Remember Iceland ? Stay with British institutions which is both good for Britain as well as depositors, because if a foreign institution goes bust and then the foreign government defaults on its obligation to pay (as Iceland has apparently done) then the British tax payer will be black mailed into stepping in to cover this money as the consequence of not doing so would result in a run on virtually all banks. Stock markets - My in-depth analysis for stocks will follow, but rising interest rates are not particularly good for stocks as higher yields will attract investors away from stocks, which is not conducive to anywhere near as strong a bull run during 2010, therefore suggestive more of sideways trend for the stock market during 2010. Commodities - Rising inflation is good for commodities but rising interest rates less so for zero yielding assets such as gold, still my forecast of November 2nd 08 still stands as of Gold $1042, in that target $1300 by March and higher still during the second half of 2010. I will again do an in depth analysis on gold this month as part of the Inflation Mega-trends ebook. Press and Economic Organisation Interest Rate Expectations Bank of England interest rates 'will not rise until late 2011' - Houseladder - 12th Jan 2010 Alan Clarke, UK economist at BNP Paribas, says: "During 2011 GDP (gross domestic product) will be very sluggish, we will be in a soft patch and I think inflation will be very low." No UK rate hike seen until Q4 2010, QE capped -Reuters poll - Guradian - 22nd Dec 2009 * Rates to rise to 1.0 percent in Q4 next year
* Quantitative easing programme capped at 200 bln pounds
LONDON, Dec 22 (Reuters) - The Bank of England won't raise interest rates from a record low until the fourth quarter of next year, according to a majority of 62 analysts polled by Reuters,
No hike in sight for interest rates - Interactive Investor - 7th Jan 2010 "Whilst inflation is certainly rising and there are signs of growth and improvement in the both the services and manufacturing sectors, talk of a recovery is, as yet, far too premature. Until the Bank of England sees consistent evidence that banks are lending more regularly, interest rates will continue to be held at 0.5% until the beginning of 2011 at least." The above implies a current consensus view that either UK interest rates will remain at 0.5% until early 2011 or a small rise in the fourth quarter 2010 to target 1%, against my target of trend of 2% on route 3% by mid 2011. Therefore watch how the press and academic economists busily revise interest forecasts higher mid 2010 AFTER the event, i.e. AFTER market interest rates have already risen to discount behind the curve Bank of England rate rises. Much as the press ran with the forecast by CEBR UK Interest Rate Forecasts 0.5% Until 2011, Below 2% until 2014 of October 12th 2008. Which I concluded at the time had a 90% probability of being wrong as a confluence of debt monetization of the 15% budget deficit that implied higher inflation and thus higher interest rates. Source and Add Comments Here: http://www.marketoracle.co.uk/Article16450.html By Nadeem Walayat Copyright © 2005-10 Marketoracle.co.uk (Market Oracle Ltd). All rights reserved. Nadeem Walayat has over 20 years experience of trading derivatives, portfolio management and analysing the financial markets, including one of few who both anticipated and Beat the 1987 Crash. Nadeem's forward looking analysis specialises on UK inflation, economy, interest rates and the housing market . Nadeem is the Editor of The Market Oracle, a FREE Daily Financial Markets Analysis & Forecasting online publication. We present in-depth analysis from over 500 experienced analysts on a range of views of the probable direction of the financial markets. Thus enabling our readers to arrive at an informed opinion on future market direction. http://www.marketoracle.co.uk Disclaimer: The above is a matter of opinion provided for general information purposes only and is not intended as investment advice. Information and analysis above are derived from sources and utilising methods believed to be reliable, but we cannot accept responsibility for any trading losses you may incur as a result of this analysis. Individuals should consult with their personal financial advisors before engaging in any trading activities.
You're receiving this Email because you've registered with our website. How to Subscribe Click here to register and get our FREE Newsletter To access the Newsletter archive this link Forward a Message to Someone [FORWARD] To update your preferences [PREFERENCES] How to Unsubscribe - [UNSUBSCRIBE]
The Market Oracle is a FREE Financial Markets Forecasting & Analysis Newsletter and online publication. |
||||||||||||||
© 2005-2022 http://www.MarketOracle.co.uk - The Market Oracle is a FREE Daily Financial Markets Analysis & Forecasting online publication.


