


SPDR KBW Regional Bank Best Performing ETF
Companies / Exchange Traded Funds Jan 26, 2010 - 02:30 PM GMTBy: Guy_Lerner

Sorry for the catchy headline, but the SPDR KBW Regional Bank ETF (symbol:KRE) has been my best performing ETF since I first highlighted the sector back on November 18, 2009. KRE is up about 16% since then while the S&P500 has remained flat.
I bring KRE up not because I want to pat myself on the back, but because CNBC's Maria Bartiromo made this comment last Thursday as she was going to a commercial break and I paraphrase:
"When we come back from the break, we will discuss whether it is time to buy the regional banks."
Of course, Thursday was the day President Obama announced a plan to regulate the big money centered banks or those that are "too big too fail". This apparently gave a lift to the regional banks, which were up about 4% for the day while the broader market was in a swoon.
When I hear comments like Maria's, I know it is time to sell as CNBC is very good at being late to the party, and her comments had me running to the computer to pull up the chart. From an intermediate term perspective, this is probably the case; KRE has run into resistance and we can see this on the weekly chart. See figure 1. Resistance comes in at 25.22, which is a key pivot point. Thursday's high was 25.09. In this difficult tape, I would expect KRE to struggle at these levels. In other words, a pullback should be expected before moving higher.
Figure 1. KRE/ weekly
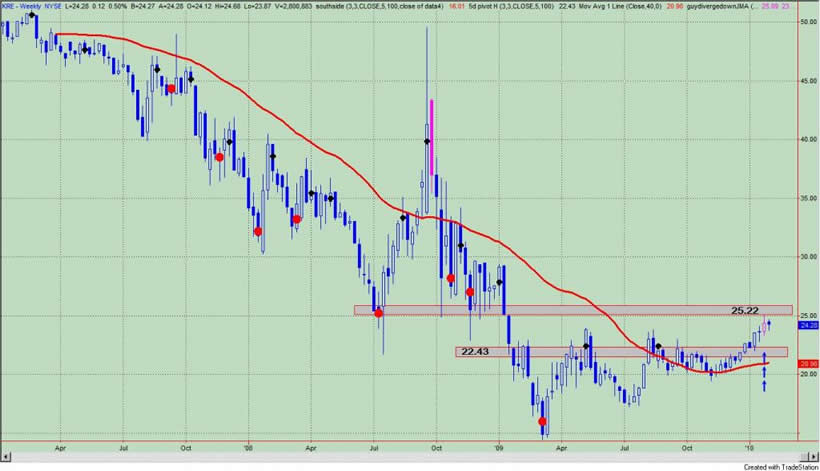
The range of the negative divergence bar - labeled in pink with blue up arrows - should serve as support and resistance. The low of this price bar is at 23.30 and the high is at 25.09. A weekly close below 22.43 would bode ill for KRE.
Lastly, all the reasons why Maria wasn't touting the regional banks several months ago still exist. Exposure to commercial real estate, increasing home foreclosures, and high unemployment have not disappeared, and although these factors have been stated risks for the regional banking sector, they have yet to rear their head. Maybe now will be the time.
In any case, I would not look to chase KRE higher in such a weak market. Longer term I still expect KRE to work its way higher.
By Guy Lerner
http://thetechnicaltakedotcom.blogspot.com/
Guy M. Lerner, MD is the founder of ARL Advisers, LLC and managing partner of ARL Investment Partners, L.P. Dr. Lerner utilizes a research driven approach to determine those factors which lead to sustainable moves in the markets. He has developed many proprietary tools and trading models in his quest to outperform. Over the past four years, Lerner has shared his innovative approach with the readers of RealMoney.com and TheStreet.com as a featured columnist. He has been a regular guest on the Money Man Radio Show, DEX-TV, routinely published in the some of the most widely-read financial publications and has been a marquee speaker at financial seminars around the world.
© 2010 Copyright Guy Lerner - All Rights Reserved
Disclaimer: The above is a matter of opinion provided for general information purposes only and is not intended as investment advice. Information and analysis above are derived from sources and utilising methods believed to be reliable, but we cannot accept responsibility for any losses you may incur as a result of this analysis. Individuals should consult with their personal financial advisors.
Guy Lerner Archive |
© 2005-2022 http://www.MarketOracle.co.uk - The Market Oracle is a FREE Daily Financial Markets Analysis & Forecasting online publication.