


US GDP: The breakdown
Economics / US Economy Jan 31, 2010 - 12:08 PM GMTBy: Vishal_Damor

 U.S. government declared its fourth quarter GDP which grew at a 5.7% annual rate. This number didn’t result from actual economic growth per se, but from a slower rate of decline of inventories. Inventory numbers that were falling at a slower rate acccounted for approximately 3.4% of the 5.7% GDP growth at the end of 2009. There has been a decrease in inventories for seven quarters in a row. Private businesses decreased inventories $33.5 billion in the fourth quarter, following a bigger decrease of $139.2 billion in the third quarter and an even biggerdecrease of $160.2 billion in the second.
Some salient points from the GDP release (as compiled by Haver analytics)
- The driver to last quarter’s growth was inventories. The 3.4 percentage point contribution from inventory accumulation was necessitated by vigorous decumulation dating back to 2005. It had reduced desired inventory levels too far below demand even though sales were then declining.
- Improvement in the foreign trade deficit also contributed one half of a percentage point to growth last quarter as exports remained strong. The 18.1% rate of increase (-1.7% y/y) followed a 17.8% 3Q gain as the lower value of the dollar continued to improve the competitiveness of U.S. products. Real imports, conversely, rose at a lesser 10.5% rate and remained down 7.7% versus last year.
- Growth in domestic final demand moderated to 1.7% after a 2.3% 3Q rise. Nevertheless, these were the first back-to-back quarterly increases since 2007. A 13.3% increase (-8.7% y/y) in business investment in equipment & software led the gain after its 1.5% 3Q rise. Investment in business construction, however, offset much of this increase with a 15.4% decline (-24.7% y/y). Residential investment also was strong and posted its second quarterly increase (-12.1% y/y). Personal consumption growth lagged with a 2.0% gain (1.1% y/y) that was dragged down by a sharp quarterly decline in spending on new autos with end of the “cash-for-clunkers” sales campaign. Spending on furniture & appliances rose for the second straight quarter (0.1% y/y) while spending on clothing surged q/q but remained down 0.7% y/y. Spending of services last quarter rose moderately (0.6% y/y). Finally, quarterly spending by governments fell slightly (+1.6% y/y), mostly due to a drop in defense spending though it remained up 3.1% y/y.
A longer and more deeper look into US GDP and inventory cycle tells us that the de-inventorization that we saw Dec 2008 and March 2009were the sharpest ever from the time that GDP was released by BEA.
Chart: GDP numbers and Inventory stocking 1947 to 2009
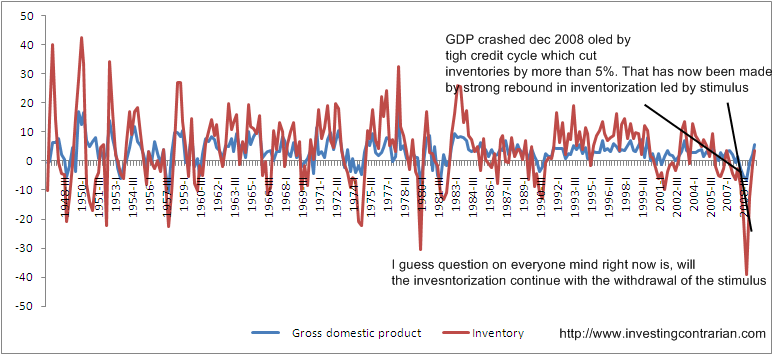
But every time inventory cycles have shrunk, US has shown a remarkable ability to spring back with a vigor that has left many surprised. The question then is whether US can repeat their past record of a vigorous inventory build up which will further lead the GDP growth onto a more stable trajectory?
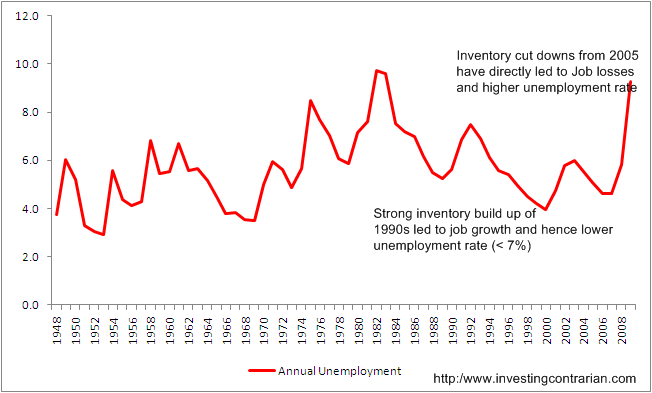
Rising Inventory cycles have been led by creation of new jobs which have led to sustained reduction in unemployment rates. Will the current cycle of Inventorisation lead to such a conclusion is left to be seen.
The 1992 -2000 period was the golden era for American middle class as Jobs were plenty. A quick look at the charts below show the reasons. They were period that were leading to strong job creation through inventory build up which in turn was being pulled through massive economic activity.
Chart:Un-employment rate 1948 to 2009:
This weeks Job numbers should be an important trend indicator on whether the strong GDP number indeed are supporting the needed jobs or are these just blips.
Vishal Damor
http://investingcontrarian.com/
Vishal Damor, works for an emerging market financial consulting firm and is the editor at INVESTING CONTRARIAN, a financial analysis and reporting site covering commodities, emerging markets and currencies.
© 2010 Copyright Vishal Damor - All Rights Reserved
Disclaimer: The above is a matter of opinion provided for general information purposes only and is not intended as investment advice. Information and analysis above are derived from sources and utilising methods believed to be reliable, but we cannot accept responsibility for any losses you may incur as a result of this analysis. Individuals should consult with their personal financial advisors.
© 2005-2022 http://www.MarketOracle.co.uk - The Market Oracle is a FREE Daily Financial Markets Analysis & Forecasting online publication.