


Copper Commodity Market Top?
Commodities / Gold and Silver 2010 Feb 03, 2010 - 04:23 PM GMTBy: Guy_Lerner

 Copper, the metal with the Ph. D. in economics, has retreated some 12% over the last 4 weeks. Possible causes include: 1) slowing economic growth; 2) withdrawal of stimulus money worldwide especially in China; 3) supply demand imbalances; and 4) bubble dynamics that has seen excessive speculation in the metal.
Now this article courtesy of Bloomberg and Trader Mark at FundMyMutualFund blog: "Copper Market Set For 'Catastrophe', says Threlkeld". David Threlkeld is president of metals trader Resolved, Inc, and apparently he gained notoriety in 1996 by calling the top in copper. He believes that similar dynamics - excessive supply and speculation -- exist in the current copper market that could lead to prices dropping over 50% from the current levels.
Possible? Anything is possible. So let's look at the technical picture to see what is really going on.
Figure 1 is a weekly chart of a continuous copper contract (symbol: @HG.C) stretching back to 1989. The indicator in the lower panel measures the number of negative divergence bars occurring between price and an oscillator that measures that price action. As we have shown many times before (see this link and this link) across multiple markets, a clustering of negative divergence bars implies slowing price momentum. Often, a cluster of negative divergence bars is a technical finding seen at market tops, but it doesn't have to be part of every market top. In any case, we now have a clustering of negative divergence bars, and this technical pattern was also seen at the 1996 top in copper that Mr. Threlkeld references.
Figure 1. Copper/ weekly
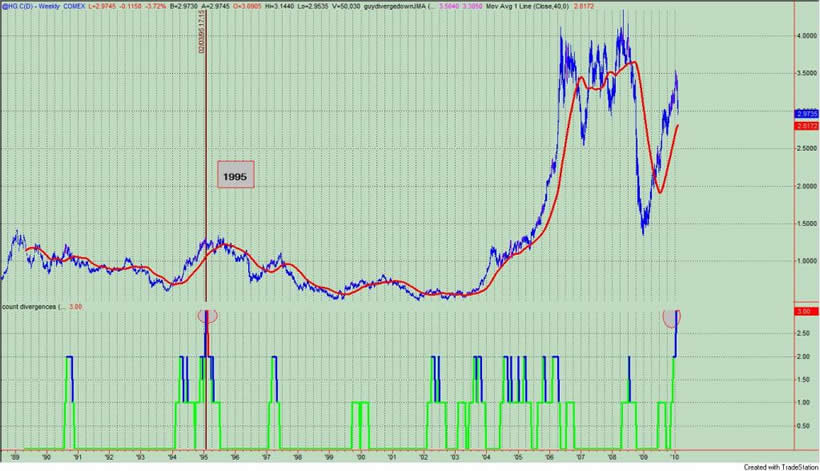
Figure 2 is another weekly chart of a continuous copper contract. Key pivot points are designated on the chart by the teal dots within the black dots; normal pivot points are in red and teal. Key pivot points are special pivot points as they are a pivot point low occurring at a time when investor sentiment towards an asset is bearish. Typically, these price levels are an area of strong buying or selling that result in either support or resistance.
Figure 2. Copper/ weekly
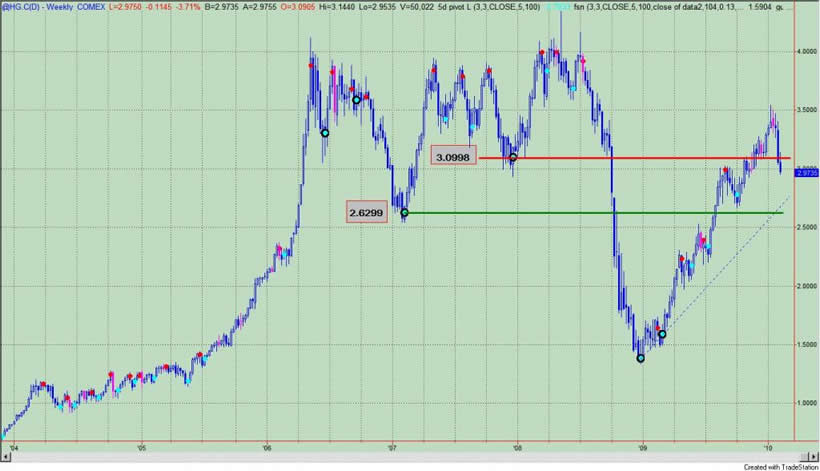
The key pivot point at 3.0998 should have been support, but copper broke through this level and this area is now resistance. The next area of support comes in at 2.6299, and this also coincides with a rising trend line. This is about 12% below the current price.
Price dynamics or how price "should" behave would suggest that a bounce should occur. If this were to happen, then one could envision a head and shoulders topping pattern forming on the chart.
In sum, Mr. Threlkeld's "call" seems plausible. Technically, the warning signs are present. It seems likely that if such a scenario plays out, it will be months in the making.
By Guy Lerner
http://thetechnicaltakedotcom.blogspot.com/
Guy M. Lerner, MD is the founder of ARL Advisers, LLC and managing partner of ARL Investment Partners, L.P. Dr. Lerner utilizes a research driven approach to determine those factors which lead to sustainable moves in the markets. He has developed many proprietary tools and trading models in his quest to outperform. Over the past four years, Lerner has shared his innovative approach with the readers of RealMoney.com and TheStreet.com as a featured columnist. He has been a regular guest on the Money Man Radio Show, DEX-TV, routinely published in the some of the most widely-read financial publications and has been a marquee speaker at financial seminars around the world.
© 2010 Copyright Guy Lerner - All Rights Reserved
Disclaimer: The above is a matter of opinion provided for general information purposes only and is not intended as investment advice. Information and analysis above are derived from sources and utilising methods believed to be reliable, but we cannot accept responsibility for any losses you may incur as a result of this analysis. Individuals should consult with their personal financial advisors.
Guy Lerner Archive |
© 2005-2022 http://www.MarketOracle.co.uk - The Market Oracle is a FREE Daily Financial Markets Analysis & Forecasting online publication.