Austrian Business Cycle Theory and Global Financial Crisis
Economics / Economic Theory Feb 08, 2010 - 01:48 AM GMTBy: MISES
 Ersan Bocutoglu and Aykut Ekinci write: Austrian business-cycle theory (ABCT) is capable of explaining the origin of the current global crisis. Therefore, ABCT provides Austrian economists with an advantageous position, compared to the other schools, in foreseeing this crisis. See, for example, Thornton (June 2004), Karlsson (November 2004), Shostak (August 2005).
 ABCT suggests that the cause of the ongoing business cycle is the difference between natural interest rates and market interest rates. Although there is no straightforward measure of the natural interest rate in ABCT, it is possible to assume that the US 10-year government-security interest rates (10YR) represent natural interest rates for the US economy, since natural interest rates are long-term rates. Assuming that federal fund effective rates (FF) are market interest rates, the relationship between the market and natural interest rates of the US economy can be illustrated as shown in figure 1 for the period 1962–2009.

Relationship between the US 10-Year government security interest rates (10YR) and effective federal-funds rates (FF) in the period 1962–2009
The grey columns in figure 1 indicate the contraction periods of the US economy, as determined by the National Bureau of Economic Research. It is evident that in the contraction periods, the Fed put into effect expansionary monetary policies by lowering market interest rates. Before the global crisis, the lowest effective federal-funds rate was realized by the Fed during the process following the 2001 contraction period.
Through this process, FF was reduced from 6.51% to below 2% in a single year. It hit its lowest point in December 2003 with a percentage of 0.98%. After catching up above 2% in December 2004, FF reached an interest rate band of 5.24–5.26% between July 2006 and July 2007.
The magnitude of the difference (DIF) between 10YR and FF is given in figure 2. The positive regions in the figure show the periods of high DIF, when market interest rates were lower than natural interest rates. During contractions, FF generally goes over 10YR, while a reverse trend occurs during expansions. The current global crisis erupted immediately after a period in which there was a very high, positive DIF because FF had dropped considerably below 10YR. This paved the way for "malinvestment."
Figure 2

Indeed, "malinvestment" in ABCT occurs following a credit expansion that makes investment projects previously considered unprofitable seem profitable. Juan Ramón Rallo Julián (2009) argues that
the new credit was infused through both consumers and producers. The former decided to mortgage themselves on a massive scale in order to purchase homes that, before interest rates were pushed down, were not affordable.… Producers generally decided to carry out leveraged buyouts of stocks in order to change managerial control or reduce costs of capital. As in the case of the mortgages, these leveraged buyouts would not have been profitable before interest rates dropped.
Figure 3 shows the Case-Schiller Home Price Index (CS) prepared by Standard & Poor's, with the effective federal-funds rate (FF). To Robert Murphy (2008), "the relationship between the two series is almost perfect in explaining the housing boom and bust." Property prices increased by 59% from the beginning of 1997 to November 2001, when the contraction period ended. The rise in housing prices was 83% in the period from December 2001 to June 2006, a year in which CS reached a maximum.
Murphy (2008) states that
home prices started falling once interest rates had stabilized at 5.25%. However, it is true that the housing boom started earlier than Greenspan's infamous rate cuts; from the graph, it looks to have started in about 1996 or 1997. But that is also precisely when President Clinton exempted owner-occupied homes from capital-gains taxes for the first $500,000.
Nevertheless, it is obvious from figure 3 that there is a strong relationship between the fall in FF and the rise in the Case-Shiller Home Price Index (CS). FF is inversely related to CS.
Figure 3

The process started with the credit-expansion policy, which caused considerable increases not only in property prices but also in capital goods and stock prices. Commodity price indexes such as energy, industrial-inputs, metals, and the American consumer price index (CPI) are given in figure 4. In order to facilitate comparison, the indexes under consideration were arranged on the base year 2001 (2001=100).
From 2001 to 2007, the CPI, and industrial-inputs, energy, and metal prices increased by about 19%, 113%, 117% and 226% respectively. In the same period, an increase of more than 250% occurred in the Global Dow Jones Index.
Figure 4

The primary focus of ABCT is not the fluctuation in prices of final goods and services. As a matter of fact, while the average rate of CPI inflation in the United States was 3.5% in the period 1981–2001, the average CPI inflation was 3% during the 2002–2007 expansionary period. The fact that CPI is not acting as a leading indicator during business cycles is well illustrated by the trends given in figure 4. Therefore, it would be more appropriate to take real-estate, industrial-inputs, energy, and metal prices as indicators of economic risk.
Figure 5

Figure 5 shows the real-estate, consumer, and commercial credit allocated by the commercial banks in the United States between 1980 and 2009. It is obvious that the increase in real-estate credit after 2001 deviated from the 1980–2001 historical trends of those credits. Total real-estate credis, which stood at approximately $1.7 trillion in late 2001, doubled by the late 2007 to about $3.6 trillion.
The Global Crisis
Although ABCT provides a sound approach that is capable of explaining the origin of the financial crisis in the United States, it still needs further elaboration to explainwhy the crisis has affected both the US and world economies more deeply than previous American crises had. Before 2000, the effects of various crises on the US and world economies were really moderate compared to the present crisis.
Additionally, the trend in figure 3 shows that the reaction of home prices (CS) is strictly limited to a similar FF cut executed in 1993–1994. Figure 4 also reveals that basic commodity prices such as energy, industrial inputs, and metals never increased before 2007 as much as they did in 2007. Similarly, it should be kept in mind that the rise in real-estate credits diverges from the trend established before 2002.
John B. Taylor (2009) elaborates on the unprecedented severity and global effects of the present crisis:
The effects of the boom and bust were amplified by several complicating factors including the use of subprime and adjustable-rate mortgages, which led to excessive risk taking. There is also evidence the excessive risk taking was encouraged by the excessively low interest rates. Delinquency rates and foreclosure rates are inversely related to housing price inflation. These rates declined rapidly during the years housing prices rose rapidly, likely throwing mortgage-underwriting programs off track and misleading many people.
Figure 6

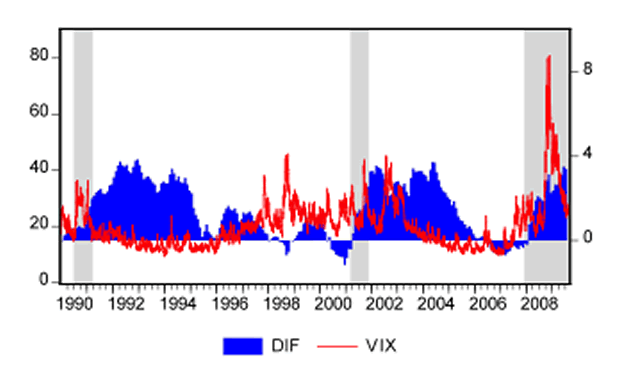
VIX Index is the Chicago Board Options Exchange (CBOE) Volatility Index, which shows the market's expectation of 30-day volatility. This volatility is meant to be forward-looking and is calculated from both calls and puts. The VIX index is a widely used measure of market risk and is often referred to as the "investor fear gauge." Figure 6 presents the VIX index and "DIF," the difference between 10YR and FF, during the period 1989–2009.
A rise in the VIX index corresponds to a rise in the risk perception of financial actors. It is a well-known fact that the VIX index falls as the DIF rises and vice versa (figure 6). The negative correlation between DIF and risk perception is consistent with the Austrian proposition that credit expansions due to artificially reduced market interest rates lead to underestimation of risk; the increasing DIF in 2002–2004 can be said to have lowered the risk perception in financial markets in the years prior to the present crisis.
Figure 7

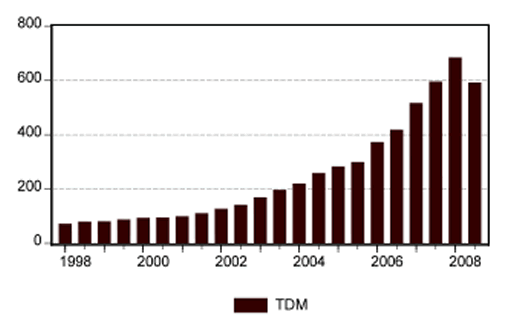
Figure 7 indicates the developments in the total derivative market (TDM). The market has grown so rapidly since 2001 that total volume of TDM reached $683 trillion in 2008. It should be emphasized that TDM was 2.98 times the world GDP in 2000, and 11.25 times the world GDP in 2008. The fact that credit booms are encouraged by derivative instruments has substantially increased the destabilizing effects of an artificial credit-expansion policy carried out by keeping the market interest rates below natural interest rates.
Ersan Bocutoglu teaches economics at Karadeniz Technical University, in Turkey. See his homepage. Send him mail. See Ersan Bocutoglu's article archives.
Aykut Ekinci is an economist in the risk-monitoring department of the Development Bank of Turkey. See his blog. Send him mail. See Aykut Ekinci's article archives.![]()
© 2005-2022 http://www.MarketOracle.co.uk - The Market Oracle is a FREE Daily Financial Markets Analysis & Forecasting online publication.


