


Stocks Bear Market and Crash Bomb Damage Assessment for Key Asset Categories
Stock-Markets / Investing 2009 Feb 08, 2010 - 09:32 AM GMTBy: Richard_Shaw

 This article takes a look at results for important asset categories since several key dates: (1) the approximate October 2007 stock markets high, (2) the approximate March 2009 stock markets low, (3) YTD 2010, and (4) since the January 19, 2010 election breaking the 60% Democrat super-majority in the US Senate.
Given the traumatic last several days in the markets, it is important to step back and see where we’ve been, and to put the recent movements in larger perspective.
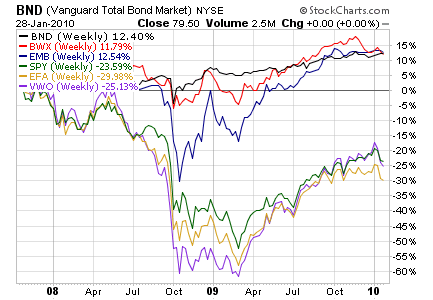
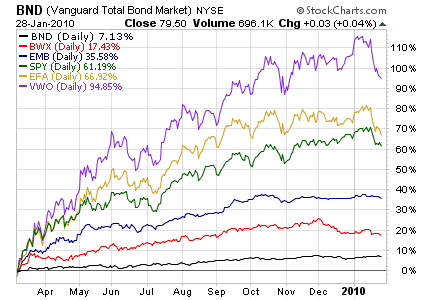
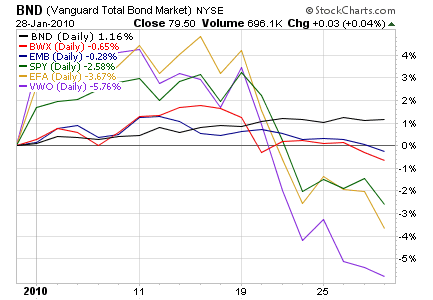
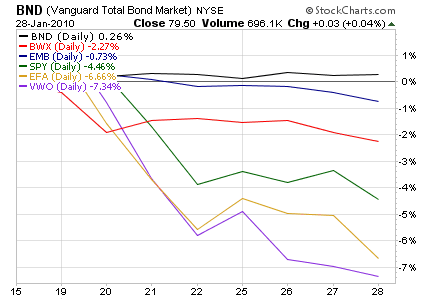
The key asset categories are US bonds (proxy: BND), local currency developed market sovereign bonds (proxy: BWX), USD denominated emerging markets sovereign bonds (proxy: EMB), US stocks (proxy: SPY), developed markets stocks (proxy: EFA), and emerging markets stocks (proxy: VWO).
Since the stock markets highs, bonds were the place to be (stocks were negative). Since the stock markets lows, stocks were the place to be (but bonds were positive). YTD and since the Massachusetts elections (cause and effect, we don’t know), bonds were the place to be (US bonds were positive, but not foreign bonds).
Longer terms, bonds are not the place to be if rates rise, which would indicate improving conditions favorable to stocks, if the rise were not to drastic. If rates rise out of control, that would be bad for stocks and bonds, thus favoring tangible investments which themselves have minimal costs of carry (that route has its own set of special problems too).
All is not well right now. We have attempted to gauge downside in another article. We could just be in an oversold condition that is the pause that refreshes, or we could be in an intermediate-term correction. As a result, we have exited positions that violated important support indicators, and will re-enter when price action is once again favorable for them.
We have not independently verified that each of the six securities in the following charts are all plotting total return. There are occasional inconsistencies in some charting services in presenting a mixture of price return and total return.
Since October 15, 2007
Since March 9, 2009
Since January 1, 2010
Since January 19, 2010
Global Asset Allocation by Dow Jones:
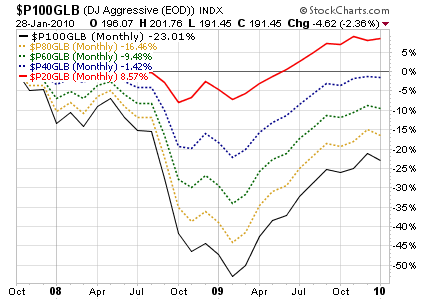
Dow Jones publishes a “relative risk” index for investors investing in stocks and bonds globally. The monthly charts that follow are from the the approximate stock markets high in October 2007, and from the approximate stock markets low in March of 2009, each through the most recently completed calendar month, December 2009.
The charts show five risk levels based on the percentage of stocks in the portfolio (100, 80, 60, 40 or 20). They are total return indexes.
Since October 1, 2007 – December 31, 2009
Since March 1, 2009 – December 31, 2009
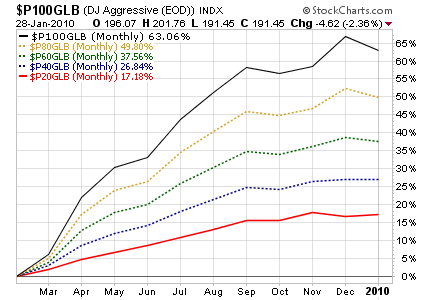
Low stock allocation of 20% was positive since the October 2007 stock markets high, and 40% stocks was nearly break-even since then. All allocations were positive since the March 2009 stock markets low.
Holdings Disclosure:
As of January 28, 2010, we have positions in BND and EMB in some managed accounts. We do not have positions in any other securities discussed in this document in any managed account.
Disclaimer:
Opinions expressed in this material and our disclosed positions are as of January 28, 2010. Our opinions and positions may change as subsequent conditions vary. We are a fee-only investment advisor, and are compensated only by our clients. We do not sell securities, and do not receive any form of revenue or incentive from any source other than directly from clients. We are not affiliated with any securities dealer, any fund, any fund sponsor or any company issuer of any security. All of our published material is for informational purposes only, and is not personal investment advice to any specific person for any particular purpose. We utilize information sources that we believe to be reliable, but do not warrant the accuracy of those sources or our analysis. Past performance is no guarantee of future performance, and there is no guarantee that any forecast will come to pass. Do not rely solely on this material when making an investment decision. Other factors may be important too. Investment involves risks of loss of capital. Consider seeking professional advice before implementing your portfolio ideas.
By Richard Shaw
http://www.qvmgroup.com
Richard Shaw leads the QVM team as President of QVM Group. Richard has extensive investment industry experience including serving on the board of directors of two large investment management companies, including Aberdeen Asset Management (listed London Stock Exchange) and as a charter investor and director of Lending Tree ( download short professional profile ). He provides portfolio design and management services to individual and corporate clients. He also edits the QVM investment blog. His writings are generally republished by SeekingAlpha and Reuters and are linked to sites such as Kiplinger and Yahoo Finance and other sites. He is a 1970 graduate of Dartmouth College.
Copyright 2006-2010 by QVM Group LLC All rights reserved.
Disclaimer: The above is a matter of opinion and is not intended as investment advice. Information and analysis above are derived from sources and utilizing methods believed reliable, but we cannot accept responsibility for any trading losses you may incur as a result of this analysis. Do your own due diligence.
Richard Shaw Archive |
© 2005-2022 http://www.MarketOracle.co.uk - The Market Oracle is a FREE Daily Financial Markets Analysis & Forecasting online publication.