


A Few Thoughts on the Recent Credit Crisis - Half of All Hedge Funds Gone?
Stock-Markets / Financial Crash Aug 03, 2007 - 09:03 PM GMTBy: John_Mauldin

In this issue:
Inflation is Baked into the CPI Numbers
The Mortgage Pig in the Python
Housing Starts Look to Stop
A Few Thoughts on the Recent Credit Crisis
Half of All Hedge Funds Gone?
Golf, Weddings, and Europe
With the economy increasingly looking like it will slow down materially in the last half of the year, there is a drum beat for the Federal Reserve to cut rates. But how likely is a rate cut this year? We take a very different look at inflation to see if there is any room for the Fed to give a boost to the economy. We look over our shoulder at Japan and the yen carry trade and ask a heretical question: does the Fed cutting rates make any difference?
Inflation is Baked into the CPI Numbers
Last Monday, I used an excellent piece by friend and money manager John Hussman for my Outside the Box. Buried at the end in the piece was a throwaway line that really intrigued me and spurred some research:
"If you look carefully at the CPI figures (and tinker with the monthly numbers), you'll also discover that even if the figures average a 2% annual rate in the months ahead, the year-over-year headline CPI inflation rate will be pushing 4% by November. This is already 'baked in the cake.' Since Bernanke is clearly concerned with the inflation expectations of the public, as well as the Fed's credibility, that headline CPI figure may create some complications for cutting rates in the months ahead, unless resource utilization falls out of bed."
That intrigued me. So, I went to the Bureau of Labor Statistics database on the CPI (Consumer Price Index). And John is right. There are some very interesting implications in the numbers. You can see them at http://www.bls.gov/cpi/cpid0706.pdf .
I reproduce them below, rounding the numbers to the nearest one-tenth. This is the all items CPI or the so-called headline CPI, which includes food and energy. These are not seasonally adjusted, but are the actual numbers with 1982-84 as the base. (If you look at the website, there are two series. The other starts in 1967. For our purposes, either will do.) Note that starting in August of last year a very interesting thing happens. The index starts to go down and drops all the way into the end of the year. Let's go to the table.
The number drops to 201.5 in November. As a quick aside, that means prices have essentially doubled since the starting period, or things cost twice as much as they did in 1982-84 which started with a value of 100. The index was up to 208.4 by this June. If prices merely (!) stay flat for the next five months that would mean inflation would be around 3% for the 12 months ending in the 4th quarter.
What happened to cause the numbers to go essentially flat for six months? Housing, which is 42% of the CPI, was essentially flat for the last six months of 2006, but has risen. Gasoline dropped over 60 cents a gallon. Natural gas only rose a small amount. Food was essentially flat. All of the inflation for the last 12 month for the actual numbers was in the first six months of this year.
This is a pattern that we can see in the first table, where a lot of annual inflation is in the first half of the year and gets tamer in the latter half.
But how likely are prices not to rise in the latter half of this year? Headline inflation is running well over 3% for the just first six months of the year. If that pace were kept up, headline inflation for year would be over 6% for 2007!
Is that likely? Probably not, as much of the increase has been in energy and food. But it is also not likely that inflation would simply stall from here. Food prices are rising, and so is energy.
Let's say inflation moderates in the next six months to an annual basis of 2%, which would be the lowest rate for the last three years. That means in November that the index would be around 210.5 and a headline inflation rate of well over 4% year over year. As we will see in a minute, core inflation (CPI less food and energy) is over 2%, so projecting 2% for the rest of the year is a reasonable conjecture at this point.
But we are told that the Fed likes to look at core inflation. Core inflation looks to be a lot tamer, but still not below 2%.
Again, these are not seasonally adjusted numbers. But since we are only really interested in year over year results in this discussion, seasonally adjusted numbers make no difference. Core CPI was up about 2.7% for the year ended in June. Even if core inflation falls to 2% for the last half of the year (which it did last year), that will mean core inflation in December is still at 2.5%. That is well above the Fed's comfort zone of 1-2%.
Now maybe they decide to buy Paul McCulley's argument that their comfort zone should be 1-3%, but there are no indications that any Fed governor is considering such a stance. This back of the napkin analysis suggests there is little reason to expect the Fed to have the room to cut rates if they want to maintain their inflation fighting credibility. In fact, there are many who argue that they need to tighten.
What could make inflation come down? Oil prices could plunge, but that is only about 8% of the CPI. We could see a drop in housing costs as owners who cannot sell their homes decide to rent at lower prices, but this is not typically something that would show up in the data that quickly. If core inflation were to moderate back to what is was during the last half of 2006, it would still have annualized inflation at 2.2%.
Under normal circumstances, 2% core and 4% headline inflation is not an environment for the Fed to cut rates. If we were to get a rate cut in the latter half of this year, say at the December meeting, it would be in an economic environment that would not be good.
In short, we would have to see unemployment rising rapidly, consumer spending and confidence falling and a recession clearly in the offering. That is not an environment that would be positive for most markets, especially the stock markets.
So, for those analysts and investors who are hoping the Fed will cut rates and give a boost to the stock market, you need to be careful for what you wish.
The Mortgage Pig in the Python
The housing market just continues to falter. "Existing home sales declined for a fourth straight month, down 3.8% in June, although median prices rose 0.3% and inventories fell to an 8.8-month supply. In the largest drop since January, new home sales declined 6.6% in June, and are off 22.3% from a year earlier. Median prices were down 2.2%. Housing starts rose 2.3% in June although construction permits declined 7.5%. The monthly average of 1.462 million starts in the second quarter was barely above the 1.460 million figure in the first quarter. The National Association of Homebuilders' confidence index dropped to 24 in July--its lowest level since January 1991." ( www.agaryshilling.com )
Gary Shilling notes that J. P. Morgan now projects that home prices will fall 20% from their 2006 peak. He points out that this makes his call of a 25% drop last year seem slightly less radical. He writes:
 "Bernanke told Congress last month that the housing swoon 'will likely continue to weigh on economic growth over coming quarters, although the magnitude of the drag on growth should diminish over time.'"
But it will take longer than you might think for that negative influence to decrease. Let's take a look at the following table. This shows the amount of adjustable rate mortgages that reset each month for the first half of this year and will reset for the next 18 months. Note that these reset numbers are a driving factor in the increasing rise in foreclosures. Pay attention to the numbers I highlight in red for January through June of 2008. The largest portion of mortgage resets is not until next year.
We have just seen $197 billion of mortgage resets so far this year. That is less than we will see in two months (February and March) of next year. The first six months of next year will see more than the total for 2007 or $521 billion. This suggests to me that the number of foreclosures is due to rise dramatically from the already high current levels, putting more homes into a weak housing environment.
These homes that are going to see reset prices are for the most part not going to be able to be rolled over into a traditional 30 year mortgage because there is not going to be enough equity to get a traditional mortgage. While the total increase in payments is an estimated $42 billion, which is not all that large in the grand scheme of things, to the individuals who are paying the increase it is a large increase in their housing costs. My estimate is that this is about one-half of 1% of total consumer spending. Along with inflationary rises in food and energy, this is going to continue to put pressure on consumer spending.
Bernanke is right. The pressure from housing will diminish over time. But it is not going to be over in a few months. It is going to take at least another year and maybe 18 months for a bottom in the housing market to develop.
Housing Starts Look to Stop
Look at the next chart. In a typical housing market downturn, we see housing starts drop below 1,000,000 in the US. In this next chart from Shilling, notice that both housing starts and residential construction as a percentage of GDP are still way above what you would expect for a market bottom.
We are still seeing housing starts averaging close to 1.45 million on an annual basis, yet the supply of new homes are rising. New homes in many areas are starting to sell for less than used homes. Normally, a new home sells for a premium of about 10%, as everything is shiny and new.
This suggests that existing home prices are going to have to come down. Prices for new homes are falling and will fall more. As an aside, when you see that median home sales prices are not falling all that much, what is really happening is that smaller homes, typically bought by new families and first time buyers are not being sold as they cannot get subprime financing. That means that the headline price declines in the statistics are back-loaded and will show up later.
Shilling suggests that housing starts will fall to around 1,000,000 on an annualized basis at some point next year. That is a lot more pain for homebuilders.
Bottom line? We are going to see more pressure on the consumer as mortgage equity withdrawals continue to fall precipitously and as housing related jobs continue to drop. This is going to result in a much slower economy in the last half of this year. Side bet: the advance GDP number of 3.4% we got last week for 2nd quarter GDP is going to be revised downward. Little noticed in the release was that GDP was revised downward for past three years, with some quarters being revised down by as much as 0.5% three years later.
Let's revisit a chart I first used in January of this year, showing the impact of mortgage equity withdrawals on the US economy.
MEWs are down by 50% by some estimates and are dropping fast. Real personal consumption growth was an anemic 1.3% in the last quarter. GDP is likely to be less than 2% for the last half of the year, and less than 1% in the fourth quarter would not surprise me. Remember, headline inflation (technically PCE) is subtracted from the GDP number. That is one of the reasons that GDP was low in the first quarter and bounced back in the second quarter, as PCE inflation dropped by almost 2%.
Yes, I know that is not what the numbers we showed earlier in the letter demonstrate, but don't ask me for an explanation, as I do not have one. It is odd, though. If inflation is high in the last quarter, it might surprise a lot of people by giving us a negative GDP number.
The economy is going to slow down on the back of falling home prices, falling new home construction and ever smaller increases in consumer spending. The good news is that most of the economy is doing well and should keep the slowdown from becoming a serious recession. And that we will work through this in a more or less orderly fashion.
A Few Thoughts in the Recent Credit Crisis
Those who maintained that the subprime mortgage problems would be contained were wrong. It clearly spread throughout the entire credit markets. Anything labeled CDO or ABX or CLO lost liquidity. There were no bids. The market was clearly shooting first and asking questions later.
The good news is that this is for the most part simply a re-pricing of risk and that will get done over the next few weeks and months. It will take longer for Wall Street to come up with new, more credible securities to package debt to get deals done. Transparency will be the watchword in the brave new world of credit. Imagine that. People who lend money are now going to want to know who is going to pay the loan back. And the rating agencies are going to have to figure out how to create credible ratings for the new version of CDO and CLOs.
I think this is healthy. Yes, the losses for those who have subprime and Alt-A exposure are quite real. Even the equity portions and lower grades of prime mortgage securities may be at loss, given Countrywide's latest disclosure of their problems with prime mortgages.
Some BBB tranches of subprime paper are down by 60%. That is not surprising, given the quality of the loans that were made. What is very disturbing to investors is to watch what they thought was AAA credit already marked down by 10% or more. Some AA credits are down by as much as 25%. If you bought recent A rated mortgage paper you could be down by over 50%! That is ugly.
Given that investors are not feeling very sanguine about rating agencies right now, it is understandable that they did not want to buy any more of anything until the dusts settles. Further, it was clear a few weeks ago to almost anybody that yields were going to rise. Until the market settles on what the new levels are, and more importantly what the real risks are, it is going to be difficult to get a highly leveraged merger deal done.
But some of the recent volatility was overdone. The newly minted (May 22) LCDX, which is a stand-in for high yield loans, has dropped 10%. That assumes a default rate of between 5-10%, when the actual default rate for leveraged loans for the last 12 months was just 0.12%! Look at the chart below from www.markit.com .
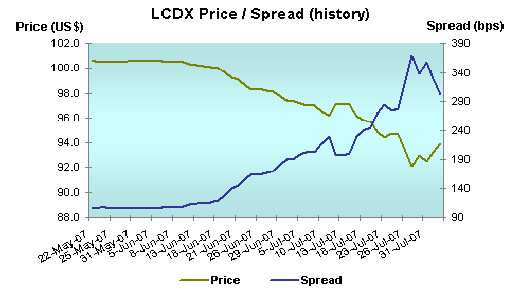
The chart shows these loan swaps trading down to 92. The market opened at 90.5 on July 27. My sources tell me that some trades were made pre-open on Monday in the 89 area. That is truly throwing the baby out with the bathwater! There were some traders who made (and lost!) money on that one.
If the fundamental risks of the market were suggesting a problem, I would be very nervous. But the recent volatility is more of a fear response (certainly justified in a very real sense) than reasoned investing. Today some of the sanity began to return as the market for these loans is rebounding.
Liquidity will eventually return to these markets. There are still vast pools of capital that must seek a return and will find its way into the credit markets. But it is going to be more savvy and less casual about where it lends money. The adults are getting ready to take control. The young quants will now be going to the penalty box. And survivors will not soon forget this lesson. The days of the cheap LBO are over. Good.
Look at it this way. Leveraged Buy Outs were routinely done at 12 times annual cash flow with debt equal to 10 times cash flow at a blended interest cost of 8%. This is what the banks who guaranteed these deals were expecting to be able to sell the loans at.
Now, these loans are going to be closer to 10-11%. That means you are going to have to drop your valuations to 9 times cash flow (or less) and/or put up more equity to get debt down to 8 times cash flow. Will deals get done on this new basis? Sure, but the mid-20 returns that private equity investors have come to know and love are going to drop. Perhaps by half in a lot of cases. Either that, or the stock prices are going to have to drop enough to be interesting as a LBO play.
Further, it is clear that corporate borrowers are going to pay more for their loans. That is going to put pressure on profits over time.
Think of it this way. If the Fed decided to raise interest rates by 1% over the next year, the market would fall out of bed. But the credit market just raised interest rates by about 3% in a few months! Subprime home loans without sufficient equity are a thing of the past. Credit for riskier deals is now a lot more expensive. LBO deals are getting pulled left and right. Lenders are properly going to put much more emphasis on risk and return of capital.
And it is not just in the US that credit markets are tightening. In the world's second largest economy, Japan, the financial stocks are dropping even more than they are here. UBS tells us that 25% of the foreign exchange market in Japan is now composed of retail traders. Read that again. One of the most important lenders in the world (Japan), and the source of the yen carry trade, is now in the hands of very weak players who are clearly amateur speculators piling into a market that has made a lot of money. Think day traders and dot-com stocks. If (when) the yen strengthens, it could do so violently as the retail crowd rushes for the exits.
Good friend and macro maven Greg Weldon is putting together a special report for me that will be Monday's Outside the Box. Almost no one is paying attention to Japan and the yen carry trade and its impact on world liquidity. We should be. You will want to read this OTB carefully.
All of this means more volatility in the next few months, not less.
Half of All Hedge Funds Gone?
Long time readers know that I am a huge fan of Jeremy Grantham. He is one of the smartest and most successful investors in the world. In his recent letter, he stated that "within 5 years I expect that at least one major 'bank' (broadly defined) will have failed and that up to half the hedge funds and a substantial percentage of the private equity firms in existence today will have simply ceased to exist."
I have to make a comment on that. He may be right that 50% of the hedge funds that exist today will be gone, although I doubt it will be that high. But the demise of that many hedge funds is entirely predictable and something that we should expect. Except for the largest funds, the vast majority of hedge funds are small businesses. Michael Gerber estimates that 80% of all new small businesses fail with five years of starting up, and 80% of the remainder no longer exist in the next five years.
When you think about it, the odds on being a successful hedge fund manager are not all that high. To charge the fees that they do, they have to deliver the goods consistently. In these markets, that is tough.
So, while a lot of hedge funds in the market today will no longer be here in five years, the real reason is that they simply did not generate enough cash flow for themselves and their investors to survive. You can actually have a profitable year and see your assets under management leave. 7% a year for three years is not all that exciting.
And let me make a few predictions. There will be thousands more hedge funds in five years than there are today. And the industry will be twice as large. And that is a very good thing.
Golf, Weddings and Europe
I will be going to Europe August 21 and staying there through September 5. Other than meeting with clients in London and a speech in Copenhagen for Jyske Bank, I will be mostly tourist. I plan to be in London, Copenhagen, Stockholm, Warsaw, Krakow and Prague. I will have some time to meet with clients and friends at a happy hour or dinner here and there. I always enjoy meeting interesting people and making new friends. If you want to meet in London, you can drop me a note or contact my European partners, Absolute Return Partners.
I am finishing this letter on a Thursday as I will fly to San Antonio tomorrow to be with Mike Casson and Connie for their wedding and weekend of partying with friends. Mike is the publisher for this letter and a close friend. We have been doing all sorts of business together for over 30 years (where has the time gone?). Mike is the best of Texas. In all the deals we have done, we have yet to need a piece of paper. His handshake is his contract. And his handshake is worth more than a lot of the deals I have done on paper. This world needs more people like Mike.
And I am going to try and golf on Saturday. I went to the driving range last Sunday and my back did just fine. It had gotten difficult and I had to stop three years ago, but have done a lot of abdominal work and my back is a lot stronger. I do enjoy the game, and hope to be able to start playing again.
It is time to hit the send button. Enjoy your weekend, and call a friend and let them know you appreciate them.
Your wondering if I can even break 110 analyst,
By John Mauldin
http://www.frontlinethoughts.com/
To subscribe to John Mauldin's E-Letter please click here: http://www.frontlinethoughts.com/subscribe.asp
Copyright 2007 John Mauldin. All Rights Reserved
John Mauldin is president of Millennium Wave Advisors, LLC, a registered investment advisor. All material presented herein is believed to be reliable but we cannot attest to its accuracy. Investment recommendations may change and readers are urged to check with their investment counselors before making any investment decisions. Opinions expressed in these reports may change without prior notice. John Mauldin and/or the staff at Millennium Wave Advisors, LLC may or may not have investments in any funds cited above. Mauldin can be reached at 800-829-7273.
Note: The generic Accredited Investor E-letters are not an offering for any investment. It represents only the opinions of John Mauldin and Millennium Wave Investments. It is intended solely for accredited investors who have registered with Millennium Wave Investments and Altegris Investments at www.accreditedinvestor.ws or directly related websites and have been so registered for no less than 30 days. The Accredited Investor E-Letter is provided on a confidential basis, and subscribers to the Accredited Investor E-Letter are not to send this letter to anyone other than their professional investment counselors. Investors should discuss any investment with their personal investment counsel. John Mauldin is the President of Millennium Wave Advisors, LLC (MWA), which is an investment advisory firm registered with multiple states. John Mauldin is a registered representative of Millennium Wave Securities, LLC, (MWS), an NASD registered broker-dealer. MWS is also a Commodity Pool Operator (CPO) and a Commodity Trading Advisor (CTA) registered with the CFTC, as well as an Introducing Broker (IB). Millennium Wave Investments is a dba of MWA LLC and MWS LLC. Millennium Wave Investments cooperates in the consulting on and marketing of private investment offerings with other independent firms such as Altegris Investments; Absolute Return Partners, LLP; Pro-Hedge Funds; EFG Capital International Corp.; and EFG Bank. Funds recommended by Mauldin may pay a portion of their fees to these independent firms, who will share 1/3 of those fees with MWS and thus with Mauldin. Any views expressed herein are provided for information purposes only and should not be construed in any way as an offer, an endorsement, or inducement to invest with any CTA, fund, or program mentioned here or elsewhere. Before seeking any advisor's services or making an investment in a fund, investors must read and examine thoroughly the respective disclosure document or offering memorandum. Since these firms and Mauldin receive fees from the funds they recommend/market, they only recommend/market products with which they have been able to negotiate fee arrangements.
Disclaimer PAST RESULTS ARE NOT INDICATIVE OF FUTURE RESULTS. THERE IS RISK OF LOSS AS WELL AS THE OPPORTUNITY FOR GAIN WHEN INVESTING IN MANAGED FUNDS. WHEN CONSIDERING ALTERNATIVE INVESTMENTS, INCLUDING HEDGE FUNDS, YOU SHOULD CONSIDER VARIOUS RISKS INCLUDING THE FACT THAT SOME PRODUCTS: OFTEN ENGAGE IN LEVERAGING AND OTHER SPECULATIVE INVESTMENT PRACTICES THAT MAY INCREASE THE RISK OF INVESTMENT LOSS, CAN BE ILLIQUID, ARE NOT REQUIRED TO PROVIDE PERIODIC PRICING OR VALUATION INFORMATION TO INVESTORS, MAY INVOLVE COMPLEX TAX STRUCTURES AND DELAYS IN DISTRIBUTING IMPORTANT TAX INFORMATION, ARE NOT SUBJECT TO THE SAME REGULATORY REQUIREMENTS AS MUTUAL FUNDS, OFTEN CHARGE HIGH FEES, AND IN MANY CASES THE UNDERLYING INVESTMENTS ARE NOT TRANSPARENT AND ARE KNOWN ONLY TO THE INVESTMENT MANAGER.
John Mauldin Archive |
© 2005-2022 http://www.MarketOracle.co.uk - The Market Oracle is a FREE Daily Financial Markets Analysis & Forecasting online publication.