


Stock Market Rally on Pause Until Mid March
Stock-Markets / Stock Markets 2010 Feb 28, 2010 - 07:05 PM GMTBy: Andre_Gratian

 Current Position of the Market
Very Long-term trend - Down! The very-long-term cycles have taken over and if they make their lows when
expected, the bear market which started in October 2007 should continue until 2014.
SPX: Long-term trend - Up! We are in a medium-term bull market, which is a corrective move within a long term bear
market. This bull market should last until 2011-2012.
SPX: Intermediate trend - Technically, the index is still in an intermediate move until it breaks below 1029.
Analysis of the short-term trend is done on a daily basis with the help of hourly charts. It is an important adjunct to the analysis of daily and weekly charts which determines the course of longer market trends.
Daily market analysis of the short term trend is reserved for subscribers. If you would like to sign up for a FREE 4-week trial period of daily comments, please let me know at ajg@cybertrails.com .
Overview:
At 1150, The SPX had become overbought and was in need of a correction. The 9-month cycle, which was 3 weeks away from its next low was more than willing to accommodate, helped along by the 17-week cycle which was 11 weeks into its phase.
The 9-mo cycle bottomed right on time, 38 weeks from its former low, providing an initial reversal to the downtrend and limiting it to a correction in the existing up-trend. The 17-week cycle has now completed 16 weeks and is just about ready to reverse and give some additional impetus to the move which started at 1045.
After the 22-wk cycle bottoms in Mid-march, the SPX will benefit from the combined up-thrust of all three cycles, and that should enable it continue to resist the counter-trend influence of the 4-year cycle (due to bottom in the Fall) until later in the year. The longer the uptrend extends itself, the less will be the weakness resulting from the 4-year cycle's bottoming action. This means that 1) we are not likely to see a new low in the Fall, and 2) the secondary "bull market" in which we find ourselves will probably not make its final high until some time in 2011 and perhaps even later.
The next couple of weeks should go a long way towards confirming the above scenario. As we will see, the monthly chart gives us the best evidence that we are still in an uptrend. A mental set had developed that we had started a major bear market in October 2007 -- which we have -- but its course is being plotted a little differently than the majority had expected. The super bears could not understand why we were having such a strong move from the March lows, and when we finally got a reversal at 1150, they had a sigh of relief because now we were finally on the way to new lows! While that possibility still exists, the bears may find out that the index has a more devious path in mind to its ultimate destination and new lows. We are at a critical juncture, right now. We either continue the downtrend, or resume the uptrend to new highs. The next couple of weeks should decide.
What's ahead?
Chart Pattern and Momentum
We'll start by looking at the Monthly and Weekly charts, side by side.
There is a theory among some analysts that the crossing of the 40-mo EMA by the 9-mo EMA determines bull and bear markets. That's a rather stringent requirement to impose which would make you miss a good portion of the move in either direction. If we use this for a measurement of the market position, we are still in a bear market.
Others use the 200-D EMA, which would have given us a bull market signal when it broke above 940, and we would still be in a bull market because the correction did not take us below that MA. It's a question of what time frame you want to use, and a matter of semantics. As we will see in the next chart, by the second definition, our current move would have become a bull market in July, when the index broke out of a steep down channel at the same time as it crossed above the MA at about 935.
The recent correction stopped exactly at the 200-D EMA, which was then at 1047 and with the bottoming 9-mo cycle providing a reversal, we are now a comfortable 50 points above the 200-D EMA.
The Monthly chart has a graph which loosely shows what I expect in the future. The Weekly chart depicts the trend since the March bottom in the form of a Pitch Fork, and it also says that we are still in an uptrend.
The monthly indicators have not given a sell signal. With the reversal in the bottom indicator, the weekly chart shows that we have most likely bottomed, but this will not be fully confirmed until it has moved out of its down channel and until the top one has also given a buy signal. This could take another couple of weeks.
In summary, these two charts show that the cyclic configuration called for a correction which could last into mid-March, after which the "bull market" should be in a position to move higher.
The Daily Chart (above) indicates that the move from the reversal low of 1044.50 is bullish, but mature. From an EW viewpoint, it needs one more small wave up to complete a 5-wave pattern from the low, and to restore the bullishness of the longer trend.
As long as prices remain in the Pitchfork channel and above the 200-D EMA, the SPX is still in an uptrend.
And what does the Hourly Chart (below) say? The SPX moved up sharply from its low of 1044.50 to 1112.42 before going into a consolidation. Thursday was a quick down and up, which seemed to end the consolidation by taking prices out of the small (red) channel in which it was trading. But it is also trading in a larger (black) channel and would have to move above 1110 again to get out of it.
I am no EW expert, but it seems to me that, on Friday, we completed a wave 4 from the low and are moving up in a wave 5 to about 1116 -- which was the original projection, before correcting into the 22-week cycle low in mid-month. We could even go a little higher, to about 1124 before completing 5. At least one expert disagrees and thinks that we have completed 1 and 2 from the bottom and are ready to move up in a 3 -- which would be a much stronger move than I am anticipating. He has made some excellent calls in the past, so I don't want to disregard his interpretation. The main thing is that we are both bullish, expecting higher prices next week.
Cycles
The 17-week cycle is 16 weeks along and is expected to bottom in this time frame. It may have made its low on Thursday, although that yoyo action could have been caused by the bottoming 10-wk cycle.
The 9-mo cycle apparently bottomed on 2/5.
The 22-week cycle is usually a dominant cycle and its low in mid March cannot be ignored, especially if the index makes a 5th wave from 1044.50 and is ready for a correction.
Although it does not always have a significant impact, we should pay attention to the March 1st Bradley date to see if it plays a role in the market pattern.
Projections:
If we make a new high on Monday, I would expect a move to 1116 and perhaps as high as 1124.
Breadth
The NYSE Summation Index (courtesy of StockCharts.com) is trying to get back in an uptrend after its RSI became oversold and showed a little positive divergence to the index. Since it is still trading under its moving averages, it has not fully confirmed a reversal of the downtrend and the bulls should exercise caution until it does.
My daily A/D indicator has given a buy signal and is still in an uptrend.
Market Leaders and Sentiment
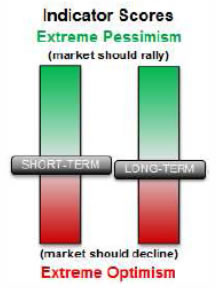
As a result of the rally, the long-term sentiment indicator (below, courtesy of SentimenTrader) condition has deteriorated from bullish to slightly below neutral, which does not give the market much more upside potential from here without a consolidation. More evidence that we will probably pull-back into the 22-wk cycle low in Mid-March.
Summary
The decline from 1151 was caused and has been interrupted by bottoming cycles. The 9-mo cycle made its low on 2/5 and has provided the initial thrust which could allow the SPX to continue its up-move.
The index must now wait until mid-march to resume its bullish trend. The 17-wk cycle is due next week, but may already have bottomed, and the 22-week could keep prices in a trading range until about March 15.
The SPX remains in an uptrend until it breaks below its 200-D EMA, or the bottom channel of the pitchfork in which it is trading.
The following are examples of unsolicited subscriber comments:
Awesome calls on the market lately. Thank you. D M
Your daily updates have taken my trading to the next level. D
… your service has been invaluable! It's like having a good technical analyst helping me in my trading. SH
I appreciate your spot on work more than you know! M
But don't take their word for it! Find out for yourself with a FREE 4-week trial. Send an email to ajg@cybertrails.com .
By Andre Gratian
MarketTurningPoints.com
A market advisory service should be evaluated on the basis of its forecasting accuracy and cost. At $25.00 per month, this service is probably the best all-around value. Two areas of analysis that are unmatched anywhere else -- cycles (from 2.5-wk to 18-years and longer) and accurate, coordinated Point & Figure and Fibonacci projections -- are combined with other methodologies to bring you weekly reports and frequent daily updates.
“By the Law of Periodical Repetition, everything which has happened once must happen again, and again, and again -- and not capriciously, but at regular periods, and each thing in its own period, not another’s, and each obeying its own law … The same Nature which delights in periodical repetition in the sky is the Nature which orders the affairs of the earth. Let us not underrate the value of that hint.” -- Mark Twain
You may also want to visit the Market Turning Points website to familiarize yourself with my philosophy and strategy.www.marketurningpoints.com
Disclaimer - The above comments about the financial markets are based purely on what I consider to be sound technical analysis principles uncompromised by fundamental considerations. They represent my own opinion and are not meant to be construed as trading or investment advice, but are offered as an analytical point of view which might be of interest to those who follow stock market cycles and technical analysis.
Andre Gratian Archive |
© 2005-2022 http://www.MarketOracle.co.uk - The Market Oracle is a FREE Daily Financial Markets Analysis & Forecasting online publication.