


Gold, Silver, Oil and Stock Index Trading Charts
Commodities / Financial Markets 2010 Feb 28, 2010 - 07:42 PM GMTBy: Chris_Vermeulen

 Three weeks ago on February 5th, we saw an extremely high level of fear in the market with selling vs. buying volume at a 9:1 ratio. We note that in 2009 this extreme level of fear occurred at the bottom of each significant pullback.
Since this panic selling low in February 2010 we have seen stocks and commodities work their way higher, which we expected. Overall the broad market looks as though it’s trying to make a move higher.
Below are some ETF charts of gold, silver, oil and the indexes.
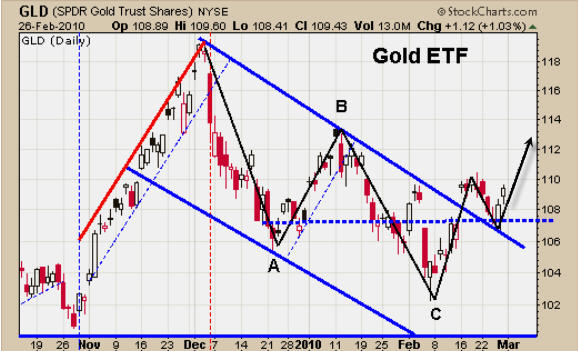
GLD Gold ETF – Daily Trading Chart
Gold lead the market higher in 2009 and also lead the market lower in December of 2009. It looks as though gold could be starting a new trend higher.
You can see the clean breakout of the down channel and then a test of the channel at support. This type of price action also forms an inverse head and shoulders pattern for those who like trading patterns. J This is very bullish price action.
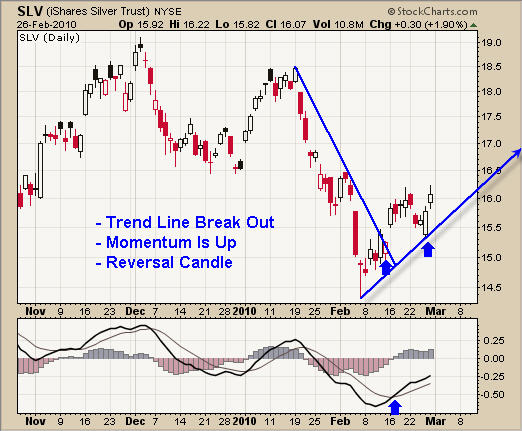
SLV Silver ETF – Daily Trading Chart
Silver has much of the same chart features as gold, but is slightly skewed. This is not particularly surprising though, as silver virtually always behaves with less defined chart patterns due to its characteristically funky price action.
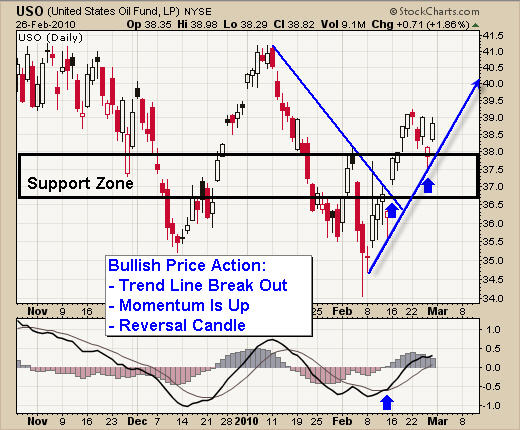
USO Oil Fund – Daily Trading Chart
As with gold and silver, oil’s trading chart has formed a pivot low also, but the trend line is much steeper than what I am looking for. I prefer a flatter trend line as price growth is more sustainable.
As you can see in on the USO chart, back in December price rallied at almost the same angle as is currently the case, and then notice what happened. Once the momentum died out the price dropped straight back down. I call steep trends like this a Parabolic Rally.
Scroll up and look at the first chart (GLD) and observe the parabolic rally going into December. It too suffered a sharp drop straight back down when momentum died out.
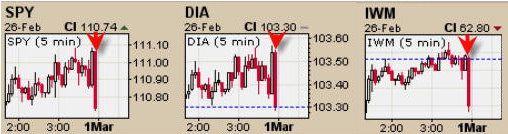
Stock Indexes – SP500, Dow Jones, Russell 2000
Last week the market sold down the first half of the week, then bounced back up forming a possible pivot low. The daily chart for these indexes look virtually the same as the GLD, SLV and USO charts above for the past 5 trading sessions.
But, one little thing has me concerned….
When looking at the 5 minute intraday charts (posted below) you can see at the very last minute before the market closed HUGE selling volume flooded the ETFs. The market ended up losing all of its gain for the day.
With any luck this was just end-of-the-month hedge, mutual fund, etc. portfolio rebalancing. But I am somewhat concerned that more of this selling could step back into the market Monday or Tuesday.
Weekend Trading Conclusion:
Overall, last week started on a negative note but ended strong after forming a reversal pattern.
It looks as though stocks and commodities have formed an ABC retrace pattern and are now ready to move higher.
How much higher you ask?
Well, I believe 2010 is going to be a traders market. I envision an 8-12 month sideways consolidation (large bull flag) forming. If this materializes then buying on over sold dips, as we did on Feb 5th, and scaling out on strength at resistance levels will be our goal in the coming months.
A bunch of 4-8% trades is what I’m figuring, but with leveraged etfs we can double and triple those type of returns. Now that is something to anticipate with delighted optimism!
If you would like to receive my free weekly trading reports please visit TheGoldAndOilGuy at: www.TheTechnicalTraders.com
Hello, I'm Chris Vermeulen founder of TheGoldAndOilGuy and NOW is YOUR Opportunity to start trading GOLD, SILVER & OIL for BIG PROFITS. Let me help you get started.
To Your Financial Success,
By Chris Vermeulen
Chris@TheGoldAndOilGuy.com
Please visit my website for more information. http://www.TheGoldAndOilGuy.com
Chris Vermeulen is Founder of the popular trading site TheGoldAndOilGuy.com. There he shares his highly successful, low-risk trading method. For 6 years Chris has been a leader in teaching others to skillfully trade in gold, oil, and silver in both bull and bear markets. Subscribers to his service depend on Chris' uniquely consistent investment opportunities that carry exceptionally low risk and high return.
This article is intended solely for information purposes. The opinions are those of the author only. Please conduct further research and consult your financial advisor before making any investment/trading decision. No responsibility can be accepted for losses that may result as a consequence of trading on the basis of this analysis.
Chris Vermeulen Archive |
© 2005-2022 http://www.MarketOracle.co.uk - The Market Oracle is a FREE Daily Financial Markets Analysis & Forecasting online publication.