


Stock Market Investor Sentiment: Few Words Needed
Stock-Markets / Stock Market Sentiment Mar 14, 2010 - 05:52 AM GMTBy: Guy_Lerner

 With 3 out of 4 of our measures registering extreme readings, few words are needed to describe investor sentiment this week.
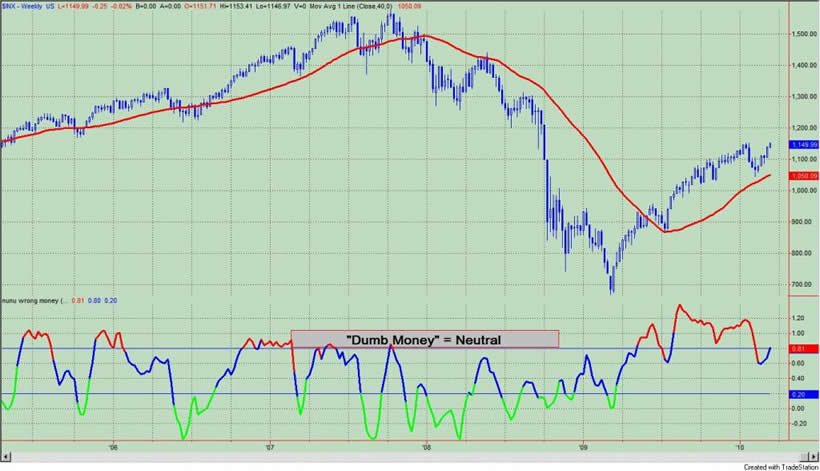
The "Dumb Money" indicator, which is shown in figure 1, looks for extremes in the data from 4 different groups of investors who historically have been wrong on the market: 1) Investor Intelligence; 2) Market Vane; 3) American Association of Individual Investors; and 4) the put call ratio. The "Dumb Money" indicator has turned bullish to an extreme degree. Extreme bullish readings in the indicator imply that a price move is nearing its end, and the ascent of prices is surely to show. This is our expectation 85% of the time. The other 15% of the time or what I like to call "it takes bulls to make a bull market" scenario, the market will continue meaningfully higher despite increasing bullish sentiment. We saw this in 1995, 2003, and 2009 when the markets were coming off of long periods of under performance. I am not banking on this time being different.
Figure 1. "Dumb Money" Indicator/ weekly
The "Smart Money" indicator is shown in figure 2. The "smart money indicator is a composite of the following data: 1) public to specialist short ratio; 2) specialist short to total short ratio; 3) SP100 option traders. The Smart Money indicator is neutral.
Figure 2. "Smart Money" Indicator/ weekly

Figure 3 is a weekly chart of the S&P500 with the InsiderScore "entire market" value in the lower panel. From the InsiderScore weekly report we get the following: 1) "Selling accelerated across all market cap groups and sectors resulting in the Weekly Score for the Entire Market falling to its worst level since the week ended February 27, 2007"; 2) in the S&P500, CEO's are leading the selling; 3) looking at the Russell 2000, the weekly score hit a multi year low.
Figure 3. InsiderScore Entire Market/ weekly
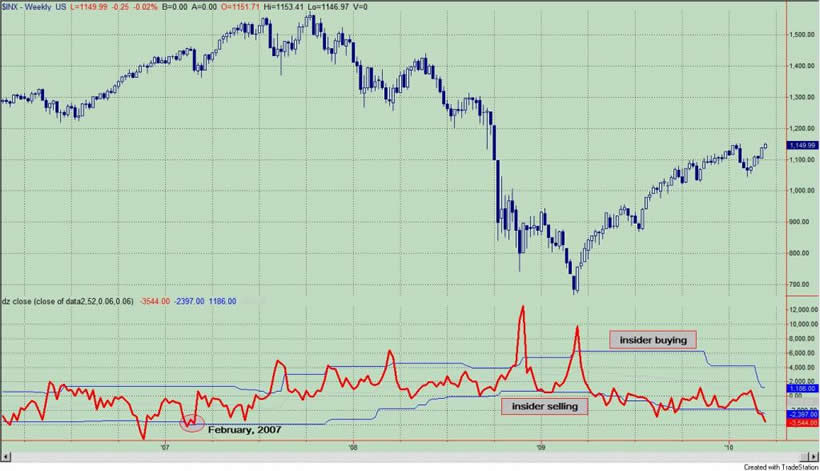
Figure 4 is a weekly chart of the S&P500. The indicator in the lower panel measures all the assets in the Rydex bullish oriented equity funds divided by the sum of assets in the bullish oriented equity funds plus the assets in the bearish oriented equity funds. When the indicator is green, the value is low and there is fear in the market; this is where market bottoms are forged. When the indicator is red, there is complacency in the market. There are too many bulls and this is when market advances stall.
Currently, the value of the indicator is 60.44%. Values greater than 58% (arbitrarily chosen) are associated with market tops, and the red dots over the price bars indicate such. Tthe value can go higher, mind you, as there was a 66% reading in 2005. During that time when the indicator hit 58% the S&P500 was at 1184; 8 weeks later the indicator hit 66% and the S&P500 hit a high of 1217. In addition, it has been my contention that the dip buyers bought the dip too early, and in all likelihood, they will be disappointed (unless they are selling now) as it will take lower prices to bring about a more lasting bottom and tradeable rally.
Shorter term Rydex measures continue to suggest excessive bullishness as these market timers have been warming up to higher prices over the past week. This data, which has proved to be very actionable, is now available for a nominal yearly fee as Premium Content. This service should help you to improve your market timing!
By Guy Lerner
http://thetechnicaltakedotcom.blogspot.com/
Guy M. Lerner, MD is the founder of ARL Advisers, LLC and managing partner of ARL Investment Partners, L.P. Dr. Lerner utilizes a research driven approach to determine those factors which lead to sustainable moves in the markets. He has developed many proprietary tools and trading models in his quest to outperform. Over the past four years, Lerner has shared his innovative approach with the readers of RealMoney.com and TheStreet.com as a featured columnist. He has been a regular guest on the Money Man Radio Show, DEX-TV, routinely published in the some of the most widely-read financial publications and has been a marquee speaker at financial seminars around the world.
© 2010 Copyright Guy Lerner - All Rights Reserved
Disclaimer: The above is a matter of opinion provided for general information purposes only and is not intended as investment advice. Information and analysis above are derived from sources and utilising methods believed to be reliable, but we cannot accept responsibility for any losses you may incur as a result of this analysis. Individuals should consult with their personal financial advisors.
Guy Lerner Archive |
© 2005-2022 http://www.MarketOracle.co.uk - The Market Oracle is a FREE Daily Financial Markets Analysis & Forecasting online publication.