


Indices and Component Stocks Charts Analysis of the Week
Stock-Markets / Stock Markets 2010 Mar 16, 2010 - 12:47 AM GMTBy: Mike_Paulenoff

 In today’s Charts of the Week, we first continue our discussion from last week about the Shanghai Composite Daily as compared to the S&P 500 and the implications for commodities. Then we look at some momentum indices (transportation, technology and financials), and apply Bollinger Band analysis to examine the near-term trends of both these indices and their key component stocks.
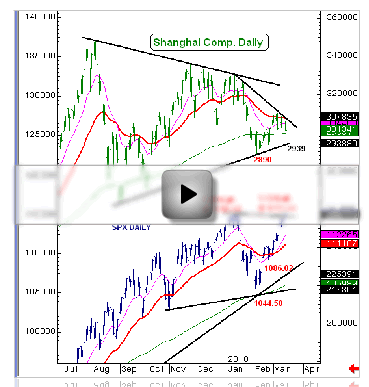
The Shanghai Composite has been making lower highs and higher lows since it peaked back in August ’09, going no where for the last eight months. This could be a reflection of the internal situation in China, fear of higher interest rates due to an overheating economy, or some other causes.
Comparing the Shanghai to the S&P 500, the Shanghai is very negative. The Shanghai closed at the low on Friday, at 3013 or so, and looks like it wants to move up to test the flat, slightly rising 200-day exponential moving average at about 2995-2993. If that breaks it could then test the multi-month support line at 2939. If it breaks through the 2939, the whole picture in the Shanghai Composite looks like a top, and it could become a drag and a destabilizing situation for the overall equity market to see China’s leading index break down.
By comparison, the S&P 500 pivoted to the upside on February 5, and has gone up 100 points or around 10% since then. This dwarfs the Shanghai’s 7–7.3% move. In addition, the S&P 500 closed right near a new high on Friday, making a new high intraday, while the Shanghai closed at the low of what has been a very difficult week last week for that index.
There’s a real divergence between the two indexes, and we’ll have to wait to see if one index impacts the other. If the Shanghai goes lower, it could have a destabilizing affect on the S&P 500.
The chart on the Shanghai Composite may be sending us a message about commodity prices and be showing us that there is a problem and China’s economy may not be as strong as we may have thought.
Going back about a year and a half ago the commodity charts shows that when the dollar was going down, gold had its big run to the upside and oil went from 47 to nearly 85. But after the dollar bottomed in November ’09 and started to move up, both gold and oil began to go down.
Oil has held up pretty well, but it keeps topping out at around the 83 – 84 level. Last week it hit a lower high of 83 and change and then turned lower on a reversal.
If the dollar stays up, that will have a detrimental impact on the commodity markets.
Comparing the Daily Dollar Index (DXY) and the PowerShares DB Commodity Index Tracking Fund (DBC), which is mostly metals and oil, to the Shanghai Composite, it’s interesting to see that when the dollar was going up in late November, the DBC held up but peaked in January and has been going down since then and it looks like it’s rolling over. Interestingly, the Shanghai peaked in November and December and started to roll over, and it looks somewhat similar to the DBC.
It could be that both the DBC and Shanghai are taking a hit, so we may need to be careful. On the Shanghai Composite side, perhaps China’s economy is not as robust as everyone would like to believe. Meanwhile, the procurement of commodities will take a hit, and that in turn means the demand side of commodities may not be all that ripe, and so the DBC is starting to roll over.
We need to be very careful here because somehow that stimulus for the last year and a half may have worked its way through the system. We’ve seen the benefit of it, getting the highs now in the US. We already saw the anticipated benefits of it in China, and now it’s starting to roll over in China, which also will have an impact on the commodities themselves, but also the commodity names in equities.
Indices & Key Component Stocks to Watch
So we’ve identified some areas that show the interconnection on the macro side of the market. Now we’ll take a look at some of the strong indices to watch and some of the big components of those indices.
The Transportation Index (DJT) has gone wild since February 5, up nearly 16%, and has outperformed the Dow. The top of the channel is at 43.82, and the DJT closed on Friday at 43.25, a 1.3% difference, which may cause some resistance.
Now let’s look at the Bollinger bands. The top band is right in line with the top of the channel. The Bollinger band sell signal is when it goes through the top band and then reverses below it. This happened in January, at the high, in the transportation sector. Now the transportation index is either bumping up against its Bollinger band or bumping up against its upper channel. If it moves another 1.3% to 1.5%, at about 43.95, especially if it closes just below the top Bollinger band, I’d be watching for a sell signal of this enormous rally that’s occurred since Feb 5.
Some of the components that could affect the transports are airlines, such as American Airlines (AMR). That has had an enormous move, characteristic of the transports, but also has had a reversal in the last few days, reversing to the downside on Wed after making new highs. The last time that happened was in September when it exceeded the Bollinger band and then came back into it, and it created a big reversal. This also happened again in January at a lower high in the transports. This time the transports have really taken off. They’ve spent the last 2-3 days above the Bollinger band, and now AMR is reversing to the downside. If it reverses here, it will give a Bollinger band sell signal that could be very significant, and we’ll have to expect it to back off.
Delta Airlines (DAL) already has given a Bollinger band sell signal, and could be building an intermediate-term top, because it failed to get above its Jan high and is giving a pretty big reversal signal.
CSX Corporation (CSX), a rail-based transportation trucker company, is trading at or above its Bollinger band line and looks like it could probably go somewhat higher. But with this kind of overbought situation based on the RSI above 80, nearly 81, you have to be looking at the 51 1/2-52 level to perhaps put a lid or a double-top on CSX.
JB Hunt (JB) reversed last Wednesday. Let’s see if it can rally back and perhaps create a Bollinger band sell signal. You had a new high in price on Wednesday but a lower high on momentum, so it looks due for a correction. This isn’t to say the chart isn’t attractive for intermediate- to long-term holders, but if you want to protect your profits or add to longs, expect to see 32 again.
United Parcel (UPS)’s doesn’t have a sell signal yet either, but if we see some strength on Monday into Tuesday, you could get a new high setting up a reversal similar to the one in January, which could mean a potentially severe correction.
So, the Dow Jones Transport (DJTA), which is the oldest and the strongest of the indices, suggests that some of its components are either very overbought and/or about to give sell signals for a correction.
The Technology Index (XLK) has also gone straight up since February 5. It had a near downside reversal Friday but not a confirmed reversal. It hit the top Bollinger band and came back off of it. It bounced down from the band, which seems to be the way it works with the XLK, mildly overbought. It’s in a position where another new high that’s not confirmed, or another new high that pierces the band and then comes back below it, could have some significant consequences for this particular index, and it could have some significant correction from this rally peak.
Components of the technology sector are Microsoft Corp (MSFT), Cisco Systems (CSCO), Apple (AAPL) and others. MSFT is at the top Bollinger band. Can it get through its 50 DMA and close above it? The Bollinger band is saying maybe not. If we get a close, for instance, on Monday above 29.50, then it can continue higher. But if you get a move above the band on Monday and then a close below it, then I think MSFT could have some severe turbulence ahead of it, as its relative strength as compared to the XLK is not very good.
CSCO popped above its Bollinger band early last week, probably in view of its announcements and the hype about its announcements. But it has gone above and closed below the Bollinger band. Maybe it can rally back to 26 1/2, but it looks like it’s out of gas for a while after a tremendous run.
AAPL had the most amazing run of all of them. It’s extremely overbought, but doesn’t show any sign yet of rolling over. The upper Bollinger band is at 232.66 going into Monday, so if we get some sort of blow-off in certain names that have been the hot stocks, AAPL among them, then look for AAPL to first break through its Bollinger band at 232-233, and then be prepared for downside on a reversal.
So, the XLK is warning us that it is running out of gas and that certain components may make new highs but those components, too, are subject to exhaustion and then corrective action on the downside thereafter.
The Financial Index (XLF) has also had a big move this past week as the banking stocks and Goldman Sachs Group (GS) reversed in a big way. The hot money ran into these stocks. It’s very overbought but not exceedingly overbought at 75 and above. It looks like it will try to make a new high. It closed at 15.54 and looks like it could go to 15.90, possibly 16, but it, too, looks like it’s subject to a Bollinger band reversal in the upcoming day or two.
Components like JP Morgan Chase (JPM) don’t look anything like the XLF at all. In fact, JP Morgan Chase (JPM) still has to get through the trend line from its October high. That shows relative weakness even though it has had a big rally. Other components of the financial sector are Bank of America (BAC), which has more relative strength in comparison the XLF than JPM, but it too looks like it’s running out of gas, and actually has turned down. It needs to hold its support levels from Friday, at 16.60-70. We get similar warning signals from Wells Fargo (WFC) and Goldman Sachs Group (GS).
All of these indexes and their components look like they are getting really frothy on the upside, and if that’s the case, then we need to be very careful. Some profit taking is likely to occur in the next several days and the pullback after that could be fairly severe. But all of this action isn’t telling me we’re going into another bear leg. Rather, it suggests that charts are fairly overdone and ripe for a pullback that creates some buying opportunities for the next leg up.
I wouldn’t be surprised if the ratio is 20 S&P 500 points on the upside to 1165-75, and then a reversal of 100-120 S&P 500 points thereafter, which will create the next buying opportunity.
See our video chart analysis of the charts discussed above.
Sign up for a free 15-day trial to Mike's ETF & Stock Trading Diary today.
By Mike Paulenoff
Mike Paulenoff is author of MPTrader.com (www.mptrader.com), a real-time diary of his technical analysis and trading alerts on ETFs covering metals, energy, equity indices, currencies, Treasuries, and specific industries and international regions.
© 2002-2010 MPTrader.com, an AdviceTrade publication. All rights reserved. Any publication, distribution, retransmission or reproduction of information or data contained on this Web site without written consent from MPTrader is prohibited. See our disclaimer.
Mike Paulenoff Archive |
© 2005-2022 http://www.MarketOracle.co.uk - The Market Oracle is a FREE Daily Financial Markets Analysis & Forecasting online publication.