


Weekly Gold and Silver Technical Analysis Report - 12th August 2007 - Technically Precious with Merv
Commodities / Gold & Silver Aug 12, 2007 - 08:18 PM GMTBy: Merv_Burak

You'll sleep better at nights if you just focused on the intermediate or longer term trends. As an example, both moving averages of gold remained positive as did the price momentum indicator. Not yet time to panic from the perspective of these time periods.
GOLD : LONG TERM
Despite the volatility in the price action the long term P&F chart has not moved. I'll forgo any analysis of the P&F chart this week. You can go to last week\s commentary which remains unchanged.
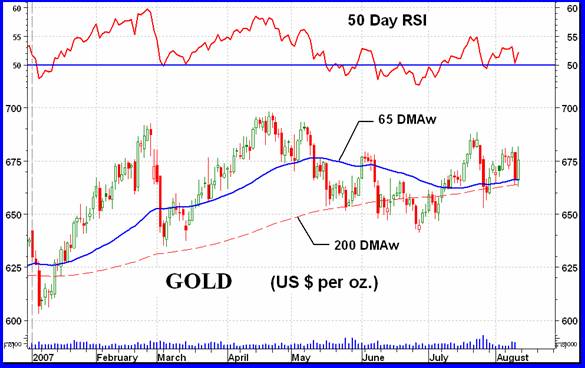
As for the normal indicators, these have also changed very little. Gold is still above its long term moving average line and the line is still slightly pointing upwards. Price momentum is still in its positive zone but has been showing weakness versus price action for some time. The volume indicator remains below its trigger line and the trigger is still sloping downward. The volume indicator is the one indicator that has gone negative and has been negative for most of the past few months.
I know Thursday was scary but I must remain BULLISH on the long term based upon the P&F , moving average and momentum, which are all still positive.
INTERMEDIATE TERM
The action on Thursday just about crossed the intermediate term moving average line but stopped just above it. The line continues to head higher. The intermediate term momentum, although just above its neutral line, is not going anywhere and continues to suggest weakness in the price action. The volume indicator is oscillating just above and below its trigger line without any real hint as to which way it wants to go. I will continue with my previous NEUTRAL rating for this period.
SHORT TERM
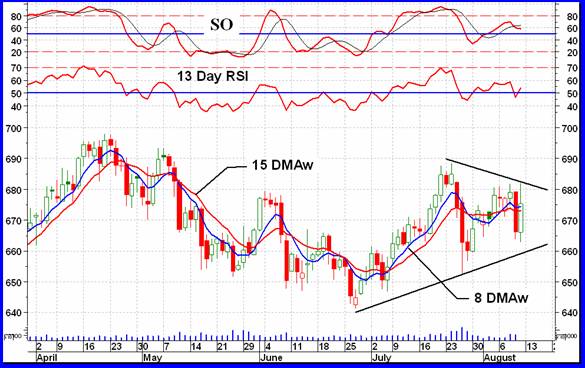
Wow! That was some two days. Now what? At the present time it's difficult to determine which way gold really wants to move. The short term momentum indicator is no help here, although it has moved into the positive zone. We seem to have a megaphone pattern (two converging trend lines) and for now the best guess is that the move will continue inside the megaphone for another week. A close above $682 or below about $660 should determine the next short term trend.
IMMEDIATE TERM
Well, here we go with a coin toss again to see what Monday and Tuesday might bring. Monday might see some more minor upside but in the end I don't expect gold to do much over the next day or two. Again, watch the limits mentioned in the short term analysis as to a new direction.
NORTH AMERICAN GOLD INDICES
This week we're back to the S&P/TSX Global Gold Index. All of the major North American Indices closed the week on the up side, although mostly by only a fraction of a percentage point. The S&P/TSX Global Gold Index closed up 0.6%, just about at the average of the 5 majors I follow here each week. The chart shows a weak Index with the recent trading activity near the low of its 15 month trading range. Momentum is in the negative zone and continues to show weakness. It is instructive to note that the Index was higher in its June low than in the previous lows last Oct & June. The momentum, however, was making new lows this past June for a weak showing.
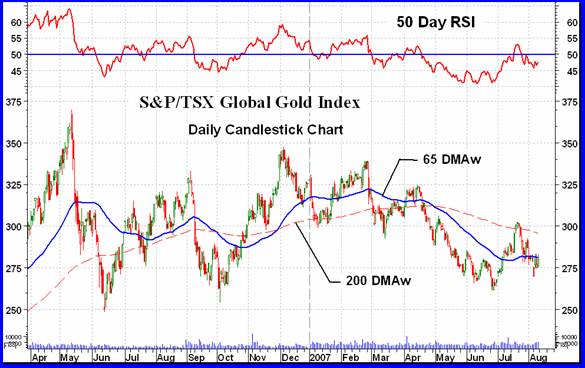
This Index is considerably lower than at the start of the year. Most other major Indices are either at their beginning of the year levels or just slightly higher or lower. The level to be watching here is the support from the previous June action, at the 250 level.
MERV'S PRECIOUS METALS INDICES
I'm on somewhat of a holiday schedule so I wouldn't go into any deep analysis of the Merv's Indices this week. Subscribers to the Merv's Precious Metals Central service can go to the various tables of technical information and ratings and should be able to follow what's happening with help from the tutorial available.
The Composite Index closed lower during the week although the major North American Indices were higher. The losses were mostly in the Merv's Indices (see comment below) and the FTSE Africa & Johannesburg Indices. Both the intermediate and long term moving averages are turning down while the long term momentum is still slightly positive. Another week of negative action and the overall Composite Index may go decidedly bearish.
MERV'S GOLD & SILVER 160 INDEX
The different sector Indices went their separate ways this past week (see comment in next section). Overall, the universe went negative. Not only was the Index lower by 2.7% but the ratio of losers to winners was a decidedly negative 2 to 1. We had 102 stocks closing lower (64%) and 53 stocks closing higher (33%). Although there were many double digit winners during the week, the double digit losers over powered them for a net negative. It was mostly a “quality” week. When summing up the individual component stock ratings, all time periods remain in the BEARISH camp. This week's decline has moved the Index below its previous June/July support and confirmed a double top break. This suggests at least another 8% drop in the Index to come.
MERV'S QUAL-GOLD INDEX : MERV'S SPEC-GOLD INDEX : MERV'S GAMB-GOLD INDEX
It was most definitely a “quality” week this past week. The Qual-Index closed higher by 0.6% while the Spec-Index closed lower by 1.4% and the Gamb-Gold Index was the biggest loser of the three with a loss of 3.5%. The difference between the quality performance versus the gambling performance can be seen in the number of winners in each Index. There were 20 winners (67%) in the Qual Index while only 4 winners (13%) could be found in the Gamb Index. Although both the Qual and Spec Indices are still above their June/July support levers the Gamb Index has now broken below its support for a strong warning of the negative sentiment towards the more aggressive stocks.
SILVER
Silver acted very much like gold during the week except with a little more down side. For the past few months now silver has been acting weaker than gold, possibly as a warning indicator for gold action. In any event, things do not look too bright for silver.
MERV'S QUAL-SILVER INDEX : MERV'S SPEC-SILVER INDEX
As with the gold Indices, the silver Indices went their separate ways depending upon quality. The Qual-Silver Index finished the week with a gain of 0.4% while the Spec-Silver Index tanked with a loss of 5.1%, the largest loss of the seven Merv's Indices. The difference between the two Indices is also noted by the difference in the weekly winners. The Qual Index had 50% winners while the Spec Index had only 16% winners. As with the Gamb-Gold Index, the Spec-Silver Index has broken below its June/July support and is in a well defined down trend.
Merv's Precious Metals Indices Table
As mentioned earlier, I am on a somewhat holiday schedule so will be posting the commentaries in a limited format over the next few weeks, but will endeavor to hit the important messages of the weekly activity.
By Merv Burak, CMT
Hudson Aero/Systems Inc.
Technical Information Group
for Merv's Precious Metals Central
Web: www.themarkettraders.com
e-mail: merv@themarkettraders.com
During the day Merv practices his engineering profession as a Consulting Aerospace Engineer. Once the sun goes down and night descends upon the earth Merv dons his other hat as a Chartered Market Technician ( CMT ) and tries to decipher what's going on in the securities markets. As an underground surveyor in the gold mines of Canada 's Northwest Territories in his youth, Merv has a soft spot for the gold industry and has developed several Gold Indices reflecting different aspects of the industry. As a basically lazy individual Merv's driving focus is to KEEP IT SIMPLE .
To find out more about Merv's various Gold Indices and component stocks, please visit www.themarkettraders.com and click on Merv's Precious Metals Central . There you will find samples of the Indices and their component stocks plus other publications of interest to gold investors. While at the themarkettraders.com web site please take the time to check out the Energy Central site and the various Merv's Energy Tables for the most comprehensive survey of energy stocks on the internet. Before you invest, Always check your market timing with a Qualified Professional Market Technician
Merv Burak Archive |
© 2005-2022 http://www.MarketOracle.co.uk - The Market Oracle is a FREE Daily Financial Markets Analysis & Forecasting online publication.