The Stock Market Is Patterned, Here's Proof
Stock-Markets / Elliott Wave Theory Mar 24, 2010 - 03:47 PM GMTBy: EWI
 You don't have to sift through the latest economic data as if they were tea leaves.
This is an excerpt from Elliott Wave International's free Club EWI resource, "What Can a Fractal Teach Me About the Stock Market?" by EWI's president Robert Prechter.
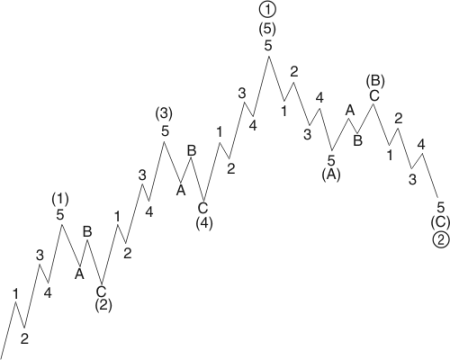
In the 1930s, Ralph Nelson Elliott described the stock market as a fractal -- an object that is similarly shaped at different scales. Scientists today recognize financial markets’ price records as fractals, but they presume them to be of the indefinite variety. Elliott found something different:

You see that each “wave” within the overall structure subdivides in a specific way. If the wave is heading in the same direction as the wave of one larger degree, then it subdivides into five waves. If the wave is heading in the opposite direction as the wave of one larger degree, then it subdivides into three waves (or a variation).
Understanding how the market progresses at all degrees of trend gives you an invaluable perspective. No longer do you have to sift through the latest economic data as if they were tea leaves. You gain a condensed view of the whole panorama of essential trends in human social mood and activity, as far back as the data can take you.
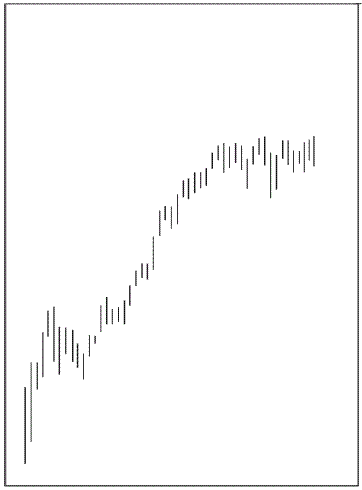
OK, now you try it. Figure 3-7 shows an actual price record. Does this record depict two, three, four or five completed waves? Based on your answer, what would you call for next?

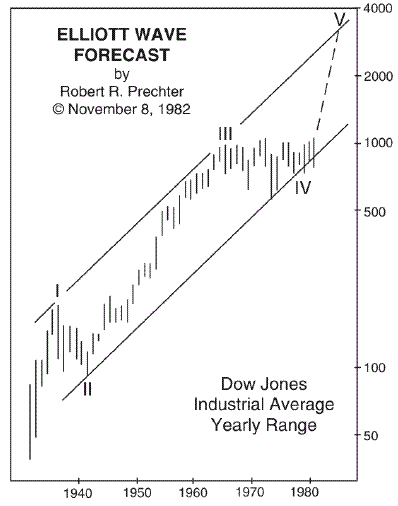
Let’s compare your answer with mine. From the simple idea that a bull market comprises five waves, The Elliott Wave Theorist in September 1982 called for the Dow to quintuple to nearly 4000 and on October 6 announced, “Super bull market underway!” The November 8 issue then graphed the forecast for the expected fifth wave up, as you can see in Figure 3-8.

As you can see, Elliott waves are clear not only in retrospect. They are often -- particularly at turning points -- quite clear in prospect.
Read the rest of this important report now, free! All you need is to create a free Club EWI profile. Here's what you'll learn:
- How Is the Stock Market Patterned?
- The Necessity and Efficiency of .5-3.
- Examples of Real-World Long-Term Waves: DJIA, Gold, CRB
- The Fibonacci Sequence in the Wave Principle
- Why Is the Stock Market Patterned? Investors' Herding Impulse
- More
Visit Elliott Wave International to learn more about the free "What Can a Fractal Teach Me About the Stock Market?" report.
Elliott Wave International (EWI) is the world’s largest market forecasting firm. EWI’s 20-plus analysts provide around-the-clock forecasts of every major market in the world via the internet and proprietary web systems like Reuters and Bloomberg. EWI’s educational services include conferences, workshops, webinars, video tapes, special reports, books and one of the internet’s richest free content programs, Club EWI.
© 2005-2022 http://www.MarketOracle.co.uk - The Market Oracle is a FREE Daily Financial Markets Analysis & Forecasting online publication.


