Emerging Markets - Chinese Red-chips Soar into Orbit, is Gold Next ?
Stock-Markets / Analysis & Strategy Dec 27, 2006 - 05:00 PM GMTBy: Gary_Dorsch
2006 was a year of extreme volatility in the global money markets. Once again, the biggest stock market winners were the emerging giants of Brazil, China, India, and Russia, the so-called BRIC countries. Together, the BRIC account for 50% of the world's population, yet their rapidly growing economies account for only 13% of global economic output. The four emerging markets have been star performers, while European, Japanese and the US markets lag behind their blazing trail.
The global economy produced around $36.7 trillion in goods and services in 2006, with emerging economies expanding an average 7% this year, largely as a result of high commodity prices, and booming demand in China and India, the World Bank said. The pace of expansion in emerging economies could remain above 7% in 2007, lead by 9.5% growth in China, 8.5% growth in India, and exceeding the 2.6% average growth rate of high-income countries in Europe, Japan, and the US.

|
China’s Enterprise H-share index of mainland companies listed in Hong Kong, wins the gold medal for market appreciation across the globe in 2006, posting a 92% gain so far this year. Most foreign investors interested in China’s companies have bought the H-shares, or mainland companies that list in Hong Kong or New York and comply with international accounting and governance rules.
|
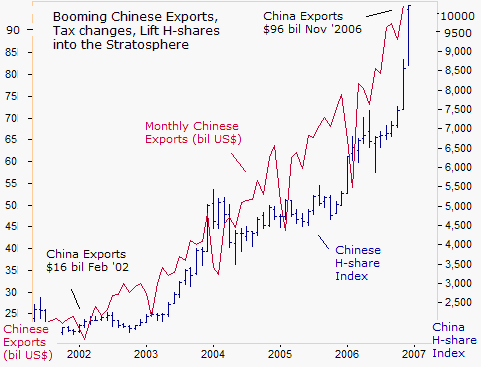
The H-share index is fueled by a 29% annualized increase in industrial profits, and a 17% increase in the Chinese M2 money supply. China’s economy is expanding at a 10.4% rate this year, the fourth straight double-digit annual gain. Chinese traders have discounted several more years of double-digit gains for the local economy, with the H-share index eclipsing the psychological 10,000-level on Dec 27th.
China’s exports grew 32.8% from a year earlier in November to a record $96 billion, while annual import growth stood at 18.3 percent. China is set to run up a $229 billion trade surplus with the US this year, more than 13% greater than the record 2005 surplus. China passed Mexico as the second- largest US trading partner in the first 10 months of this year, only behind Canadian-US trade. Nearly 87% of China’s trade surplus is derived from the one-way highway to the US market.
China’s stock markets went ballistic on Dec 27, when the China Securities Journal revealed that

Beijing plans to set a unified corporate income tax rate of 25%, and will scrap the decade-old

preferential tax rate of 12% for foreign firms. The draft law under consideration, if approved by
the People’s Congress, could be introduced after March 2007. Right now, domestic based companies

have the heavier tax burden, and are at a disadvantage when competing with foreign based firms.
Chinese banks are currently subject to a statutory 33% income tax rate on top of a 5% business tax. The expected corporate tax reform will enhance the earnings of most domestic banks by between 10% and 20 percent. But Chinese banks are not cheap, and trade at a sector average of 2.5 times their forecast book value in 2007, a 20% premium to the 2.1 average of global emerging market banks.

China is the emerging economic super-power of the 21st century, and has moved into fourth place, ahead of the UK economy, quickly catching up to #3 Germany, but still far behind Japan and the US. Beijing’s foreign currency reserves have soared to one trillion dollars, and are on course to reach $1.5 trillion by 2010, with cash inflows expected from foreign trade, foreign direct investment, and interest earned on US and foreign debt. Where will Beijing direct its future FX reserves?
Capitalization of the Shanghai Stock Exchange reached 6.3 trillion yuan and the Shenzhen Stock Exchange amounted to 1.7 trillion yuan, making China the largest emerging stock market in the world. China’s capital market equals 40% of its GDP, up from 18% in 2005, and has been soaring in leaps and bounds since June, overtaking South Korea and India in market value in the past two months.
Chinese stock markets soared last week, when the US Treasury Department, under Henry Paulson, refused to label China as a currency manipulator, and instead agreed to steps by Beijing to let its yuan currency rise in value against the US$ at a snail’s pace. Also, the US Commerce Department rejected a petition on Dec 19th, asking it to label China’s currency policy a subsidy that could have led to the imposition of tariffs on Chinese-made imports.
News that the US Treasury would not label China as a currency manipulator led a stampede into the Chinese H-share Index, rocketing higher to a record 10,213 on Dec 27th, and up 92% from a year ago. It’s not wise to try to pick a top in a frenzied Asian stampede, but traders should carefully elevate their protective sell-stops along the way, while Chinese red-chips mimic the US Internet craze of the late 1990’s.
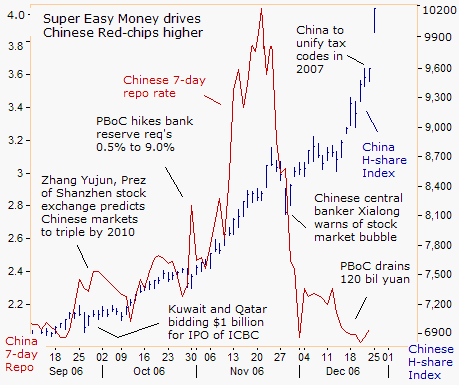
Hong Kong brokers say the recent market rally is driven by excessive liquidity as plenty of hot money is waiting to buy initial public offering stocks in Hong Kong and in mainland China, but the market may need a consolidation in January. The People’s Bank of China is printing huge amounts of yuan in exchange for foreign currency entering the country from trade surpluses with the US and foreign direct investment.
The only 3-day pullback in the Chinese H-share index since early October occurred on November 27-30th, when Chinese central banker Wu Xialong warned that excessive availability of funds in the money markets would lead to asset price bubbles. “The basic situation now is that liquidity is excessive, this is very dangerous. The central bank’s growth targets for the M2 money supply and bank lending have not been strictly met,” Wu was quoted as saying.
China’s 7-day repo rate erupted to as high as 3.9% on Nov 20th, amid fears that the Chinese central bank was ready to take strong action to drain yuan liquidity. On Oct 27th, the PBoC had lifted bank reserve requirements by half-point to 9 percent. But the 7-day repo has since plunged to 2.05% once traders realized that Xialong was bluffing, and the PBoC wasn’t going to drain enough liquidity to bust the bubble.
Hong Kong Stocks Climb to Record heights
Hong Kong’s benchmark Hang Seng index hit a record of 19,665 on Dec 27th, hitching a ride to the soaring Shanghai and Shenzen stock markets. A free trade agreement started in January 2004 between Hong Kong and China, has reinforced China’s influence as a key driver of Hong Kong’s economy. One third of China’s external trade goes through Hong Kong, and re-exports account for 92% of Hong Kong total exports. Its three top export partners are China, Japan and Taiwan.
Hong Kong is Asia’s main trading hub and one of the world’s most open economies. Business environment is favorable to foreign investments: simple legal framework, soft taxation and above all, almost no customs duties and no non-tariff barriers. Hong Kong is the second destination for foreign direct investments in Asia, and is the second largest Asian money market and the world’s fifth largest banking center.
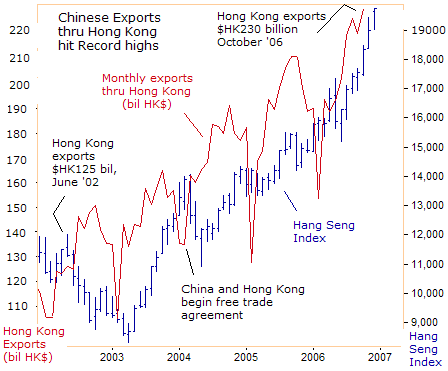
Re-exports thru Hong Kong, are expected to boost the city’s economic growth rate to 5% in 2006, but strength from the financial sector and the property market could lead to upside revisions. Hong Kong surged past New York this year and became the world’s second most popular place, after London, for companies to float new stock listings. Hong Kong’s big advantage is that it has a solid legal and financial system that can handle big initial public offerings, or IPO’s.
Shanghai isn’t close to being able to match this city, and that’s why a parade of China’s biggest banks decided to launch record-breaking IPO’s in Hong Kong this year, led by the $21.9 billion offering in October by Industrial & Commercial Bank of China, 1398.HK, the mainland’s largest bank with 155 million depositors. 1398.HK overtook HSBC Holdings Plc as the world’s third largest bank by market value after its share value rose to a record $214.2 billion this week.
Hong Kong has raked in $39.57 billion in IPO’s, nearly twice as much as last year. London was the world leader for IPO equity with $48.92 billion, Hong Kong was second and New York was third with $33.61 billion, which included the January-November period. If China becomes a large economy rivaling the US over the next 20-years, then Hong Kong could outpace New York and London. Hong Kong is heavily dependent on listings by mainland Chinese companies. The firms make up nearly 50% of the total market capitalization of $1.6 trillion.
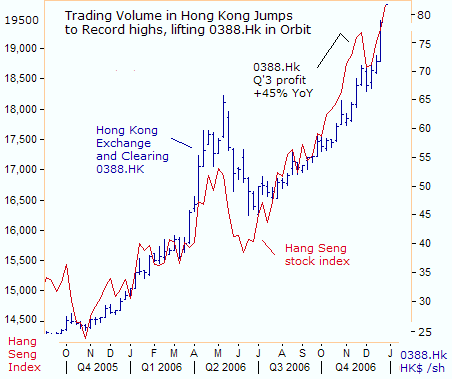
Hong Kong Exchanges and Clearing 0388.HK, which operates the local stock exchange, has tripled in value this year, riding a big bull run to record profits of HK$2.1 billion this year, up 50% from 2005. It earned HK$566 million in July-September, up 45% on a year ago and beating a 5% gain in Singapore Exchange’s SGXL.SI earnings for the same period. Since Oct 1st, the Hong Kong Exchange’s daily turnover has averaged nearly HK$40 billion, up almost one-third from the volume generated in the first nine months of the year.
Hong Kong lists China’s largest Gold miner, Zhaojin Mining
Zhaojin Mining Industry, the largest gold miner in the eastern Chinese province of Shandong, raised 2.19 billion Hong Kong dollars, in an IPO in Hong Kong last week. Zhaojin sold 172.8 million new shares at $HK12.68 /share, after individual investors ordered about 530 times the shares originally offered to them. The portion of the IPO reserved for fund managers was cut to 50% from 90% to meet the retail demand.
The orders for Chinese gold miner shares reflected growing demand for protection against a falling US dollar against the yuan. Standard Bank Group of South Africa and Global Investment House of Kuwait were among the companies investing in Zhaojin, which benefited from a surge in gold prices. The Hong Kong shares of Zijin Mining Group and Lingbao Gold, the only other publicly traded Chinese gold producers available to international investors, have risen 50% this year.
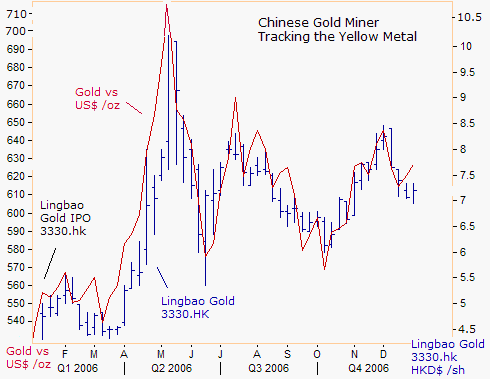
Zhaojin derived 96% of its first-half revenue from gold product sales, making gold price fluctuations the biggest risk for the company. Hedging activities are prohibited in China and any decline in the gold price could adversely affect earnings. Zhaojin controls 130.5 tons of gold, at an average mining cost of $264 /ton. Zijin Mining 2899.HK, owns 375 tons of gold at an average cost of $156/ton, while Lingbao Gold 3330.HK, controls 105 tons of gold at a cost of $252 /ton. Chinese gold miners are likely to produce 240 tons this year, with industry profits exceeding $770 million.
Beijing expands Gold market to small Chinese investor
The Shanghai Gold Exchange lowered the size limit for trading in gold bars this week, from one kilogram ($20,000) to 100 grams to expand the market to small private investors. The SGE is also developing derivatives, including futures, options and investment funds for gold, according to the Xinhau news agency. Sales of gold bullion and gold bars account for 10% of gross gold consumption in China.
China will consume a record 350 tons of gold this year amid surging sales of gold bullion, up 17% from 2005. China is the world’s third-biggest consumer of gold after India and the United States. Chinese gold demand in 2005 exceeded 300 tons, 80% of which went to the jewelry industry. According to the World Gold Council, China’s central bank has 600 tons of gold holdings, equivalent to about 19.3 million ounces. Gold accounts for less than 1.3% of the central bank’s foreign reserves.
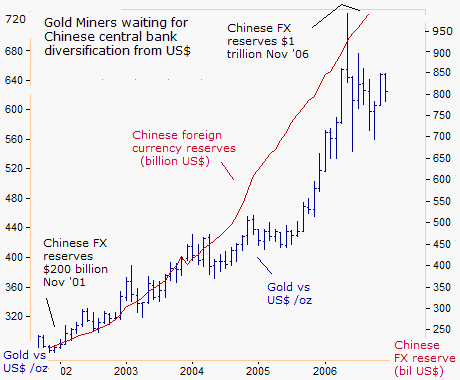

Instead, China’s central bank holds about 70% of its $1 trillion of FX reserves in US bonds, which is keeping US mortgage rates low and cushioning the deflating US housing bubble. Beijing must continue to buy US bonds with its export earnings, if it wants the Bush administration to veto any protectionist legislation that might come out of the Democratic led US Congress in 2007.
The Bush administration has overseen the loss of 3.1 million US manufacturing jobs in the past four years, largely due to a cheap Chinese yuan and Japanese yen against the US dollar. Meanwhile, massive military spending by the Bush administration in Afghanistan and Iraq, coupled with tax cuts for Americans, has wiped out the federal budget surpluses inherited from the Clinton administration and has increased the fiscal deficit to an all-time high.
US military spending on the invasion and occupation of Afghanistan and Iraq now totals well over $ 600 billion and is costing US taxpayers $ 8 billion a month and the bill could rise even higher if Bush follows through with his plan to increase US troop levels in Iraq. Therefore, the Bush administration will continue to ask Beijing and Tokyo to finance the US deficit and hold onto their US bonds, despite the hollowing out of the US manufacturing sector, which was contracting in November.
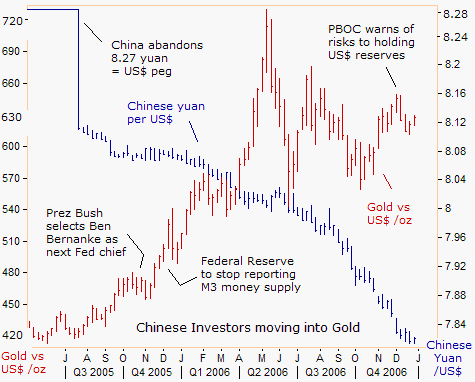
China’s central bank issued a warning on Dec 7th, about the risks of US dollar weakness. “If external capital stops flowing into the United States, a significant drop in the US dollar may occur with consumption and investment shrinking, interest rates rising and financial markets experiencing turbulence, endangering global financial and economic stability. There could be adjustments in how European private capital, Asian foreign exchange reserves and oil export proceeds are invested.”
“If the US current account deficit continues to grow faster than GDP, then the investment value of US assets may be subjected to doubts and challenges and the willingness of investors to continue holding and buying US financial products may weaken. This could cause changes in capital flows, the exchange rates of major currencies and the value of foreign exchange assets,” the PBoC said.
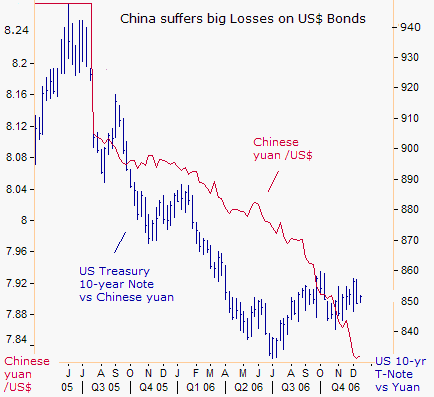
East Asian holders of US dollars face the risk of a dollar devaluation, said Chinese deputy central bank governor Wu Xiaoling on Dec 24th. Firstly, long-term US interest rates are falling, reducing returns on bond investments. Secondly, the exchange rate of the dollar, which is the major reserve currency, is going lower, increasing the depreciation risk for east Asian reserve assets,” Xialong concluded.
Looking forward, some of the big questions are how high can Chinese stocks fly, and what is the biggest downside risk to investing in the Chinese markets today? Where will China diversify its FX reserves in 2007? The answers will be reported to paid subscribers of the Global Money Trends newsletter in a special report, to be posted to the www.sirchartsalot.com website on Thursday, Dec 28th.
** To “Stay on Top of Volatile Markets”, subscribe to the Global Money Trends newsletter published around the 1st and 15th of each month in pdf format, and 20-25 pages in length. GMT collects a wide array of news and information from reputable sources, filters out the noise and distractions, and puts all the pieces of global economic puzzle together into coherent snapshot analyses, with lots of cool charts depicting the inter-relationships of markets and economies around the world.
Here's what you will receive with a subscription,
Insightful analysis and predictions of, (1) top stock market indexes around the world, and US-listed Exchange Traded Funds (ETF’s) and closed-end country funds. (2) Commodities such as crude oil, copper, gold, silver, the CRB index, and gold mining and oil company indexes. (3) Foreign currencies such as, the Australian dollar, British pound, Euro, Japanese yen, and Canadian dollar. ($) Libor interest rates, global bond markets and their central bank monetary policies.
Subscribers will also receive Email Alerts, sent out in-between regular newsletter postings, when important information unfolds in the global markets.
A subscription to Global Money Trends is $125 US dollars per year for 24 issues, including access to all back issues. Click on the following hyperlink, to order now, http://www.sirchartsalot.com/newsletters.php
NOTE - From time to time, The Market Oracle publishes articles from third parties. These articles do not necessarily express the viewpoints of The Market Oracle or its editorial team. © 2005-2022 http://www.MarketOracle.co.uk - The Market Oracle is a FREE Daily Financial Markets Analysis & Forecasting online publication.


