2007 Stock Market Crash Update II
Stock-Markets / Financial Crash Aug 16, 2007 - 01:21 PM GMTBy: Greg_Silberman
In late July we published a piece called 2007 crash market stock update wherein we described the inter-market picture as shaping up to be eerily similar to that of the 1987 stock market crash.
In summary: We noted that the stock market had been ignoring a falling bond market for much of 2007 in much the same way as the stock market ignored a falling bond market back in 1987. We further explained that it was not until the Bond market broke below its May lows in September 1987 that all hell broke loose in the stock market and ended up in Black Monday, a one day drop of 22% in the S&P500.
We would like to update our hypothesis about a 2007 stock market crash as the similarities continue to eerily pile up.
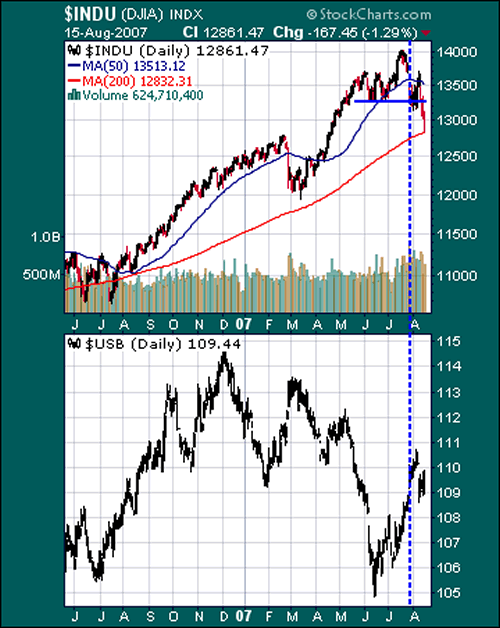
Here are updated charts from the above article:

Chart 1
2007 crash market stock update
(industrials above; bonds below)

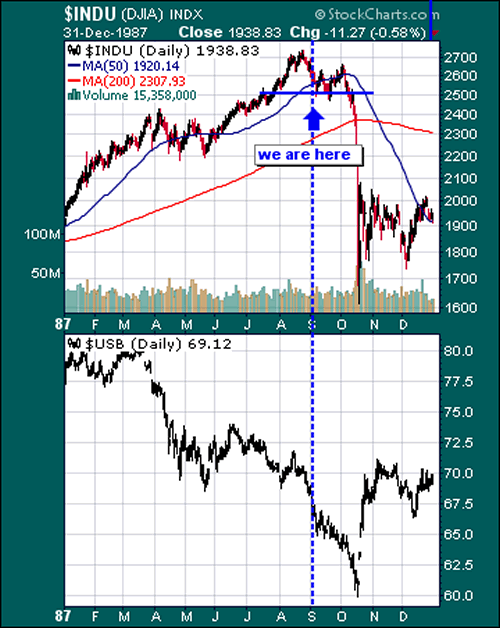
Chart 2
1987 stock market crash
(industrial above; bonds below)
We continue to remain well correlated with 1987 except with a 1-month time lag
For example, since mid July the stock market has been in correction mode and whilst we think there is even more to come – probably another 2 months to be exact – we note that this is a divergence with 1987 as the stock market only topped out in August 1987 not July as is the case now.
But probably more significant is the correlation of the current rally in US bonds today (bottom chart 1) as compared to 1987 (bottom chart 2). To be specific, what caused the waterfall in stocks in 1987 was the fact that bonds broke below their May lows in September (chart 2 – dotted line). The intervening bounce from the May 1987 low topped out in Mid-June and was approximately 5% higher.
As of today bonds also look like they have topped out around 5% above their recent lows (although this occurred in early August 2007 as opposed to June in the 1987 example).
As we said in the above article, history doesn't repeat it merely rhymes. In which case the above minutia may not be significant to the big picture and we may still be on track for a 2007 stock market crash. But for that to become a reality we would need to see Bonds continue reversing lower in earnest. In a recent article called Prime interest rates and the market value of Gold we show what we consider the most overlooked chart today – US Bonds encountering stiff resistance and looking likely to reverse lower as in the 1987 scenario.
We're certainly not out of the woods by any stretch of the imagination.
More commentary and stock picks follow for subscribers…
By Greg Silberman CFA, CA(SA)
Profession: Portfolio Manager and Research Analyst
Company: Ritterband Investment Management LLC
e-Mail: greg@goldandoilstocks.com
Website: blog.goldandoilstocks.com
I am an investor and newsletter writer specializing in Junior Mining and Energy Stocks.
This article is intended solely for information purposes. The opinions are those of the author only. Please conduct further research and consult your financial advisor before making any investment/trading decision. No responsibility can be accepted for losses that may result as a consequence of trading on the basis of this analysis.
Greg Silberman Archive |
© 2005-2022 http://www.MarketOracle.co.uk - The Market Oracle is a FREE Daily Financial Markets Analysis & Forecasting online publication.


