How To Buy Stocks In An Extended Market
InvestorEducation / Learning to Invest Apr 13, 2010 - 11:55 AM GMTBy: David_Grandey
 What should you do with an extended market or shall we say a market that doesn't pullback? When you look at the indexes, that's what we have right now.
But first let's talk corrections and consolidations -- specifically of issues that are in clearly defined uptrends. We define clearly defined uptrends a stocks that make higher highs and trade above the 50-day moving average.
Typically there are two ways that these issues correct. They either pullback or go sideways.
A good example of this is CREE from the past 6 months.
NOTE: This is what you want your whole account to look like. It makes it easy to manage that's for sure.
The first thing you'll notice is overall the stock is in a clearly defined uptrend and above the 50-day moving average. That's the first ingredient you need to have with any stock you are buying.
Just because you have that though doesn't mean you just automatically go out and buy the stock though. This is where understanding corrections and consolidations come into play.
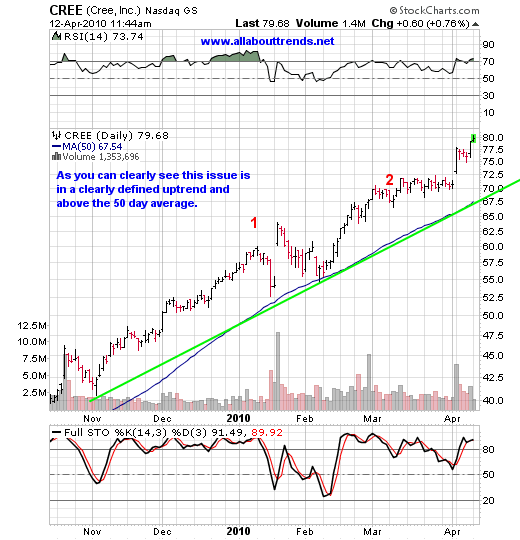
What we want you to observe is the 50-day average. We say that because a lot of stocks tend to trade off of that moving average. The 50-day average also can act as a risk management guide. Think about it with the issue above. What IF your whole account looked like this. It would b pretty easy to manage the risk wouldn't it?
If it breaks the 50-day average and it breaks its uptrend then it's time to walk away. What if you had a portfolio with 10 names that looked like this? What if all of a sudden one after another you start getting stopped out of them? Think that would be telling you something? It basically would be telling you the market is rolling over wouldn't it? At least that’s what it would be telling us.
Bottom line is this: As long as the issue is above the 50-day average and trending higher overall what more do you need to know?
As with all stocks there comes a time when they tend to get extended away from the 50- day average as shown at the red number 1 and 2 on the chart above.
Let’s hone in on the red number 1 in the chart. As you can see that red number 1 is a tad away from the 50 day. So what is one to do? Nothing you need to leave it alone and put it on the watch list of issues you are interested in on the long side. Then you wait for it to come to you.
Note: Letting it come to you is allowing it to pullback in this case. A great pattern is what we call a Pullback Off Highs (POH) chart pattern.
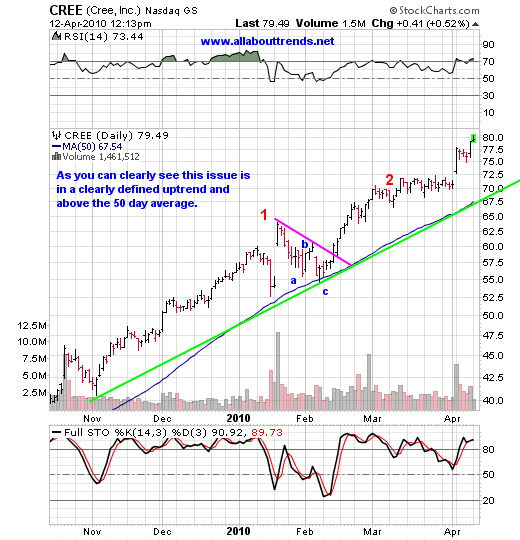
Notice what happens over the next 3 weeks? It pulls back right to the 50-day average and in so doing creates our favorite long side pattern called a Pullback Off Highs (POH). Notice that it also builds out an Elliot Wave abc pullback? They don't always do that but a lot of them do. Just call that a characteristic that tends to occur.
So now that the issue has pulled back what do you do? Well you can buy it off the 50-day average or wait for it to crossover the Pink pullback off highs line to the upside. Upon doing the mechanics of reality with regards to the stock market apply over which none of us have control over by the way.
For those not familiar with what The mechanics of reality with regards to the stock market is the following is for you:
Remember the moment you take a trade you are at the mercy of the market and have no control except when to sell. If you are not willing to take the risk and are not willing to pay that price do not take the trade.
Remember the mechanics of reality with regards to the stock market states a stock can only do one of three things: Up, Down, Nowhere. The moment you hit the enter button you are at the mercy of the market therefore the only control you have is when to sell/cover. You can't manage your gains as you have none to manage initially. Knowing this in advance it allows you to stay in outcome, that being you will either:
1. Make a gain
2. Wash
3. Get stopped out at a loss
Remember the market IS the boss. IT is going to do what IT wants to do.
NOTE: By the way all web services, research reports, brokerage reports, fund managers etc. live in this realm. ,we ALL do. We don't care who you are this is the reality of the markets. It doesn't matter who or what you subscribe to -- not one of them can get past this reality. Do yourself a favor and ingrain this in your head. No matter how hard you try you can not get away from this.
In addition to that?
Remember the moment you take a trade you are at the mercy of the market and have no control except when to sell. If you are not willing to take the risk and are not willing to pay that price do not take the trade. IF you are willing to take that risk know full well the end result could be a loss. That said make sure that portfolio management trade size is used accordingly. With any position you may take make sure that should something go awry the amount of total impact to your account does not devastate your acct. Try to stick to a 5% position That's the key to portfolio management, not biting off more than you can chew.
Moving on.
What if a stock doesn't pullback?
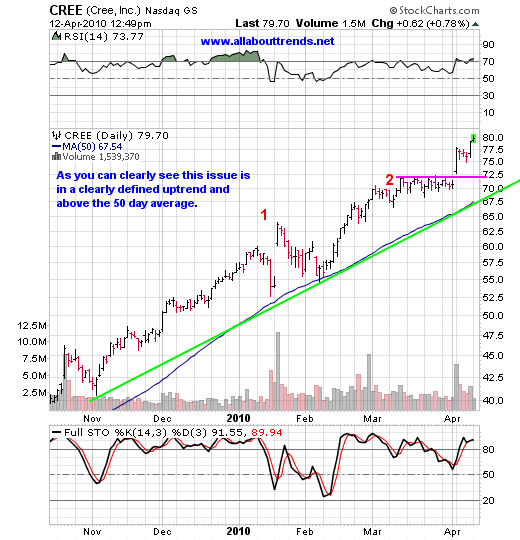
Well then that's where the Red number 2 level comes in. Notice much like level number 1 that level number 2 is also a ways away from the 50-day average and the true overall trend of the stock?
Well notice what happens over the next month? Yep, the issue ends up going sideways while the 50-day average creeps higher and catches up to it. In so doing, the issue also ends up building a base.
In this case your best off waiting till the issue breaks out of the base its building. By the same token though can you buy it as it's going sideways? Sure, but then just remember wherever you buy it your initial risk is defined as a break of the 50 day average.
In this case at the number two of 72.50 the 50 day average was at 62.50 giving you an initial risk of 10 points or 13.8%. What that means is that the stock could pullback after you bought it to its true uptrend and its true uptrend would still be intact BUT you'd be down 13.8% and in threat of stopping out right about the time the stock is ready to launch (assuming its uptrend is going to stay intact that is). This is why we want to buy them on pullbacks or after they have gone sideways for awhile and the 50-day is able to catch up.
Plain and simple the 50-day average in cases such as this define your risk.
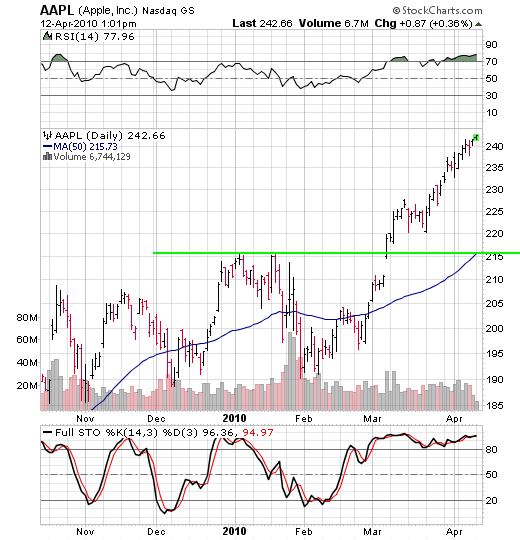
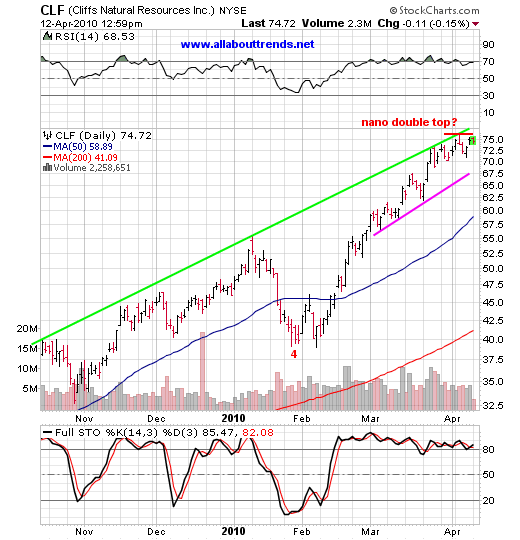
Now let's take a look at two recent market darlings of late. Now it's your turn. Look at the charts below and you tell me what you should be doing with these stocks if you are considering buying. Should you buy it right here? Or?
==========================================
Nope, both are extended and need to either pullback or consolidate in a sideways fashion.
Use the 50-day average to buy off of. The beauty of this is you are buying closer to the true trend of the overall stock vs. getting emotional and buying the news driven spikes like at the red number 1 level as shown above. Can you see where this can really increase your odds? Can you see where employing this style of entries can really give you an edge?
By using this article as a guideline it keeps you disciplined and centered and most importantly keeps your emotions in check and keeps you from chasing stocks.
By David Grandey
www.allabouttrends.net
To learn more, sign up for our free newsletter and receive our free report -- "How To Outperform 90% Of Wall Street With Just $500 A Week."
David Grandey is the founder of All About Trends, an email newsletter service revealing stocks in ideal set-ups offering potential significant short-term gains. A successful canslim-based stock market investor for the past 10 years, he has worked for Meriwest Credit Union Silicon Valley Bank, helping to establish brand awareness and credibility through feature editorial coverage in leading national and local news media.
© 2010 Copyright David Grandey- All Rights Reserved Disclaimer: The above is a matter of opinion provided for general information purposes only and is not intended as investment advice. Information and analysis above are derived from sources and utilising methods believed to be reliable, but we cannot accept responsibility for any losses you may incur as a result of this analysis. Individuals should consult with their personal financial advisors.
© 2005-2022 http://www.MarketOracle.co.uk - The Market Oracle is a FREE Daily Financial Markets Analysis & Forecasting online publication.


