World Monetary System Collapse And Gold’s Parabolic Rise
Commodities / Gold and Silver 2010 Apr 17, 2010 - 05:40 AM GMTBy: Hubert_Moolman
 We could be very close to the end of a financial era that started about 1971. The monetary system as we know it today, which is backed by a changing (non stable dollar), appears to be in its final stages and just waiting for a fierce run to gold, silver and certain other non monetary assets, to provide the death blow.
The death blow could be provided by the massive increase in the “paper prices” of gold, silver etc. over the next couple of years, which could lead to an end of confidence in fiat money and other debt based financial assets.
The current monetary order will be exposed for the fraud that it is, and it will collapse just like the monetary orders before i.e. the gold exchange standard and the Bretton Woods standard.
The biggest losers will be those that are significant holders of fiat currency. However, a collapse of the world monetary system is such a serious and profound issue, that we will all probably be losers (this generation at least).
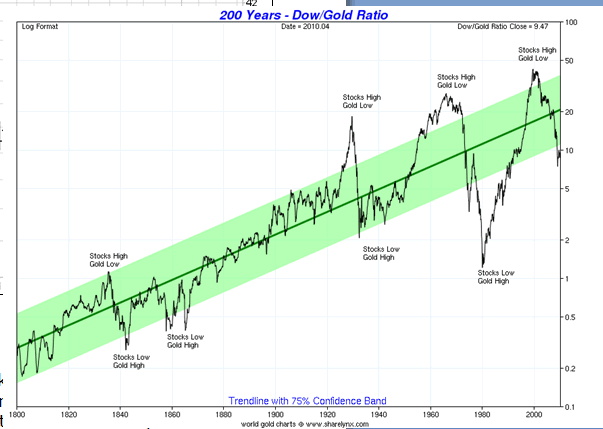
Below is a 200 year Dow/Gold Ratio chart from www.sharelynx.com. (Thanks to sharelynx.com for this useful chart and many more.)

In the last century the world’s monetary order (rules) were significantly changed during the following periods:
- In 1929 to early 1930’s when the gold exchange standard collapsed.
- In the late 1960’s finally collapsing in 1971.
These changes were brought about by the presiding powers over the system due to the pressure on the questionable system, which could be seen in the fact that financial assets (non real assets or intangible) assets had become way over-valued. In other words, the claims on tangible assets were not supported by the relevant tangible assets at an equivalent basis. There were thus way more claims than tangible assets.
What is very interesting about these dates above (when the rules were changed), when looking at the Dow/Gold ratio, is the fact that the Dow/Gold ratio had just peaked some years before that, in 1928 and in 1965 respectively.
Recently the Dow/God ratio has of course peaked in 1999 and here we are in 2010 at a time where the world’s monetary system is again fragile. Evidence of this is easily found when looking at the financial landscape especially since 2007. Here events such as the stock market crash of 2008, Iceland, Greece to name but a few come to mind.
A change is gonna come, as a famous song goes. However, this time it might be different due to fact that the final direct link between gold and dollar was already removed in 1971. How much more corrupt can you make the system? In other words, what else could be done to relieve the pressure on the system?
So this time there might be no change of the rules by “the powers that be” in order to relieve the pressure on the system as was done in 1933 and 1971, but instead, we might have the system finally collapsing by itself - by way of a devastating hyperinflationary scenario. Time will tell what it will be in the not too distant future.
Why is Dow /Gold ratio important regarding the world monetary system?
Well, it is important to know that the Dow/Gold ratio is an indicator of whether stocks are over- or under-valued in relation to real money. Also, stocks are a very significant and important financial asset; therefore, the Dow/Gold Ratio is also an indicator to which extent financial assets could be over or under-valued in relation to real money or to which extent claims on tangible assets outweigh or under weigh tangible assets.
When claims on tangible assets outweigh tangible assets (high Dow/Gold ratio or financial assets are over-valued), that premium is normally reflected in the debt levels in the financial system. Why? Simply because we have a debt based monetary system. If you study the simple basic accounting formula: Equity = Assets less Liabilities this will become even clearer.
So in 1999, as in 1928 and 1965, the peak in the Dow/Gold ratio was likely indicating that the weight of debt brought about by the very same monetary system has reached critical levels and could eventually collapse the fragile monetary order.
Implication For Gold
It is interesting that gold peaked about 14/15 years after the peak of the Dow/Gold ratio in 1965. If we had to extrapolate that to the peak in 1999, we get a possible peak in 2013/2014. In my Long Term Gold Fractal Analysis (see below), I forecast gold to peak in late 2012 for the earliest. Given the fact that these mutually exclusive forecast are so close, I have a feeling history might just rhyme once again.
Closer to the time I should be able to pinpoint the exact time when gold will peak, using fractal analysis.
Gold Fractal Analysis Report
In my Gold Fractal Analysis Report, I see gold going past the $ 1226 peak soon, past the $ 300 in the not distant future, then past $ 1500 and then past $ 3000 as a minimum.
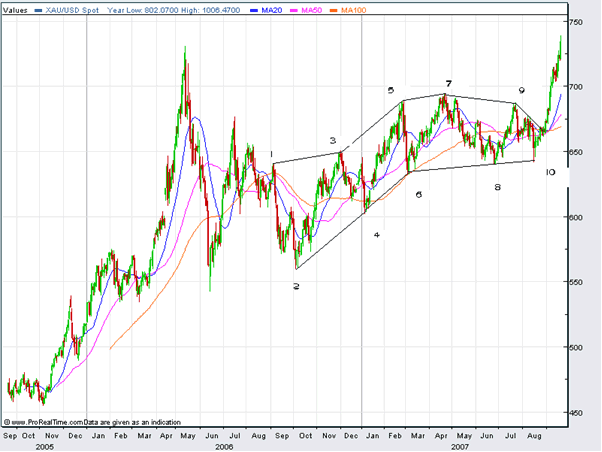
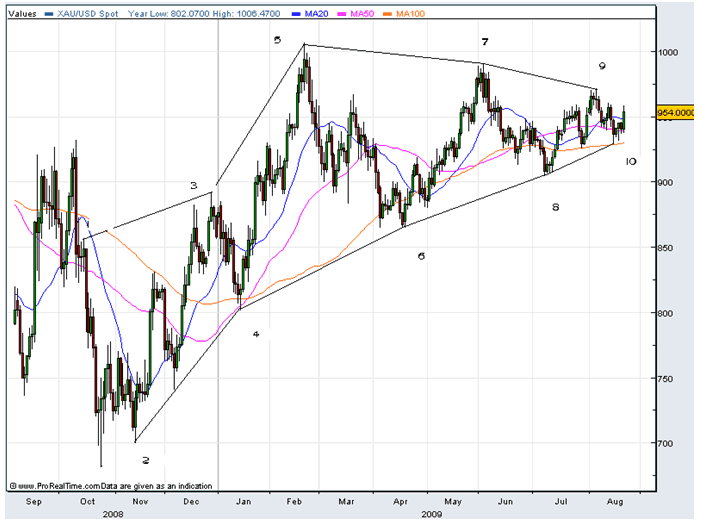
Gold, generously keeps confirming my long term view from the Gold Fractal Analysis Report. For example, in a previous article (24 August 2009) I had these to consolidations on the gold chart:

chart generated on fxstreet.com

chart generated on fxstreet.com
I made the argument that these two consolidations were similar and therefore gold will start a powerful move to the upside just as it did after the first consolidation in 2007. Soon afterwards gold started that move to $1 226 and thereby confirmed the match between the two fractals (consolidations), and what followed after them.
If you look at a gold chart you will see that what followed after the first consolidation was a strong up move that eventually formed a flag/pennant type formation. Another confirmation came over the last few months when after the second consolidation above, an upside move came which eventually also formed a flag/pennant type formation (our current 5 month plus consolidation).
So the similarity of the two consolidations is thus still continuing today.
We are now waiting for a relatively fast move above $1226 to give us more confirmation that the two patterns will play out in the same way, followed by gold rallying towards $1 500 over the next 3 to 6 months. However there will be a twist as to how these patterns will match over the longer term. That twist is determined by the longer term chart or cycle. The nature of this twist is evident in my Gold Fractal Analysis Report.
My Gold Fractal Analysis Rreport also indicates that we are in the second phase of this gold bull market and this second phase started at about October/November 2008. Further to this it indicates that the best part of the gold bull market lies ahead.
I sell my Gold Fractal Analysis Report at $50 (R 350). If you are interested please contact me via email (below). I believe it is worth the $50 (R 350) and so do those who have bought it. It is clear, concise and easy understandable even by a novice, as one of my readers has proclaimed.
I am very confident in the forecast made by this analysis and therefore I will give you your money back if the gold price does not reach $ 1300 per ounce by 31 July 2010.
***
If you find this information useful, please forward it to friends or family so that I can continue to reach people that would not normally read such informative sites as this one. If you would like to subscribe to my newsletter please send me an email. My newsletter is free and I send it out whenever I have something to “say”. I do accept donations though, so that I can continue to research and write; email me for how.
Do not forget to visit my blog, since I publish additional articles there, on a regular basis: http://blogs.24.com/hubertmooolman
May God bless you.
Hubert Moolman
You can email any comments to hubert@hgmandassociates.co.za
© 2010 Copyright Hubert Moolman - All Rights Reserved
Disclaimer: The above is a matter of opinion provided for general information purposes only and is not intended as investment advice. Information and analysis above are derived from sources and utilising methods believed to be reliable, but we cannot accept responsibility for any losses you may incur as a result of this analysis. Individuals should consult with their personal financial advisors.
© 2005-2022 http://www.MarketOracle.co.uk - The Market Oracle is a FREE Daily Financial Markets Analysis & Forecasting online publication.


