U.S. Economy and Interest Rate Forecasts Update
Economics / US Economy Apr 17, 2010 - 02:04 PM GMTBy: Paul_L_Kasriel
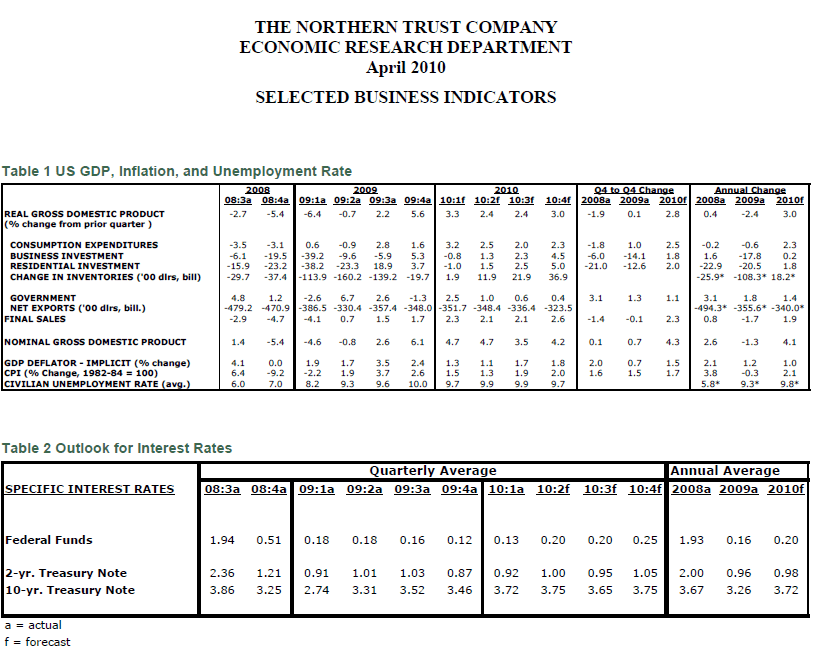
 It has been a while since we last wrote an economic and interest rate update - February 22, to be exact. There are two reasons for the absence of a March update - heavy travel schedule and not much new to say on the subject. In the broad scheme of things, the only significant change to the forecast is with respect to inflation. Back in February, we were expecting the CPI to increase by 2.5% in 2010 on a Q4/Q4 basis. Now we are forecasting an increase of only 1.7%.
Although we have raised our Q4/Q4 2010 real GDP growth forecast to 2.8% from February's projection of 2.5%, our fundamental view of the economic outlook has not changed. That outlook is for a continued muted recovery this year, muted largely because of the inability of the private financial sector to create net new credit. This lack of private financial sector net credit creation does not prohibit real economic growth. But given the severity of the past recession, this lack of net credit creation does limit the robustness of the real economic recovery.
Although our real GDP forecast for 2010 has changed little on net, we have altered the growth rate in some of the components. The principal alterations have to do with personal consumption expenditures and residential investment expenditures. Personal consumption appears to have grown faster in the first quarter than we had anticipated back in February. Moreover, judging from the strength in March retail sales, some of which might have been weather-related, second-quarter growth in consumer spending will get an arithmetic boost. That is, if nominal retail sales just remained at their March level throughout the second quarter, then second quarter's average level of retail sales would come in at an annualized rate 5% of above the first quarter's average level. But offsetting this first-half stronger-than-expected growth in consumer spending is weaker-than-expected housing activity.
As mentioned above, the factor that restrains our near-term bullishness with regard to economic growth is the lack of growth in net lending by the private financial sector and exceptionally weak growth in the M2 money supply. Although the nonfinancial sector can provide credit to itself, increases in this kind of credit tend to redistribute spending in the nonfinancial sector rather than increasing aggregate demand. For example, if the government increases it spending and borrowing and the household sector increases its saving by purchasing the increased supply of government debt, household spending goes down, government spending goes up but, all else the same, total spending or aggregate demand does not change. The household sector is merely transferring purchasing power to the government sector.
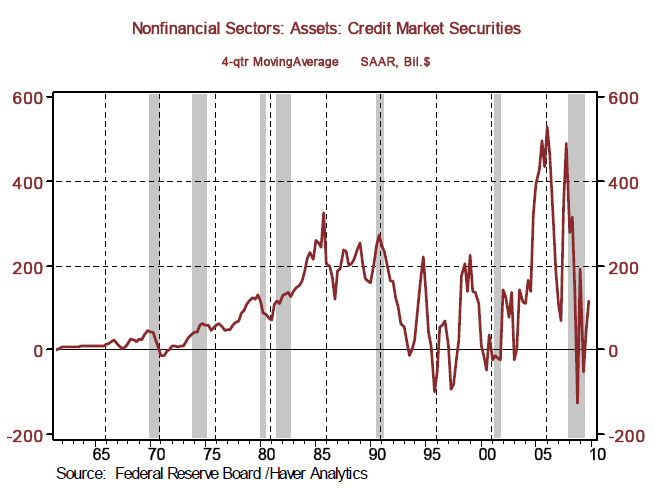
Nonfinancial sector net lending data are available on quarterly from the Fed's flow-of-funds report and even at that, the data are released only with a relatively long delay after the fact. The latest data available are for Q4:2009. These data are shown in Chart 1. In order to smooth out some of the volatility, we have presented the data on a four-quarter moving average basis. Although net lending by the nonfinancial sector did increase in 2009, its increase was small.
Chart 1
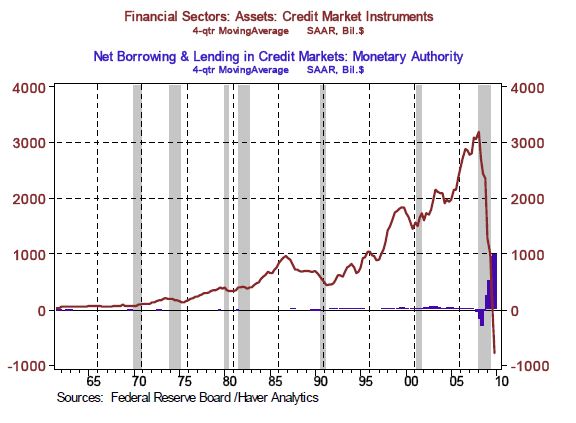
When the financial sector increases its net lending, aggregate demand (or total spending) tends to increase. This is because the financial sector, especially the banking sector, tends to create new credit rather than merely transferring purchasing power, which the nonfinancial sector does when its net lending increases. In order for the private financial sector to increase its net lending, it needs sufficient capital. When credit losses occur, capital in the private financial sector "evaporates," inhibiting net lending. And, of course, when credit losses occur, the private financial sector writes down the value of it assets, which has the accounting effect of reducing its net lending (the change in the value of its assets outstanding). Plotted in Chart 2 is the four-quarter moving average of net lending by the private financial sector. For the first time since the 1952 inception of this series, net lending by financial sector actually contracted in 2009. What is all the more noteworthy, total financial sector net lending contracted in 2009 despite a surge in net lending by the Federal Reserve.
Chart 2
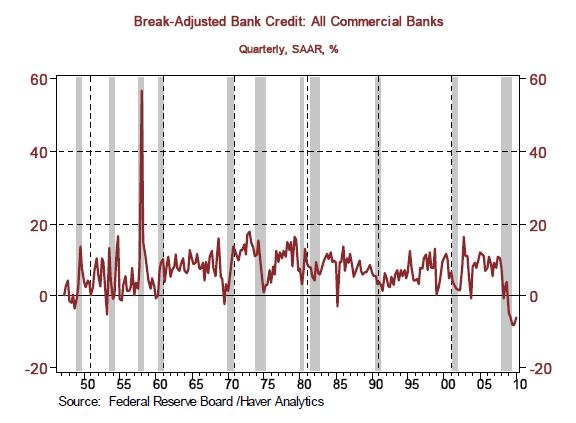
On a more current basis, the Fed provides data with respect to commercial bank lending. The news here is no more encouraging. In the fourth quarter of 2009, total commercial bank credit - loans and securities - contracted at an annualized rate of 8%. Although the rate of contraction in bank credit moderated in the first quarter of this year, at a 6.2% annualized rate of contraction, this still was more severe than anything experienced from 1947 through 2008.
Chart 3
Before getting overly pessimistic, we have to take into consideration a factor that might be causing some of this contraction in bank credit, but might not have a negative effect on current or near-term aggregate demand. A net contraction in bank credit could come about because a larger dollar amount of non-performing loans is being written off than the dollar amount of new loans being granted. The loans being written off financed past spending. The new loans being granted are financing new current spending. The result of this cause of a contraction in bank credit is a net increase in spending. (This argument was suggested by Gene Epstein in his April 10, 2010 Barron's Economic Beat article,
Credit Trouble: the Mismeasure of Borrowing - Economic Beat - G. Epstein - Barrons.com.
Now, consider an alternative cause of a contraction in bank credit. In this scenario, the dollar amount of loans being paid down by borrowers is greater than the dollar amount of new loans being granted. In order to pay down loans, the borrower has to cut back on his/her current spending. So, the result of this cause of a contraction in bank credit is a net decrease in spending.
It is difficult to know which factor is dominating the observed contraction in bank credit. Aggregate demand is growing, so the "write-down" hypothesis for the contraction in bank credit has some validity. But given how low the level of interest rates is, one might have expected even stronger growth in aggregate demand. This lends some credence to the "pay-down" hypothesis for the contraction in bank credit. Thus, as so many things in the real world are, the explanation of the contraction in bank credit is likely some combination of the two. But as a forecaster of economic activity, it is difficult to feel overly optimistic about future growth in aggregate demand with such an unprecedented contraction in bank credit.
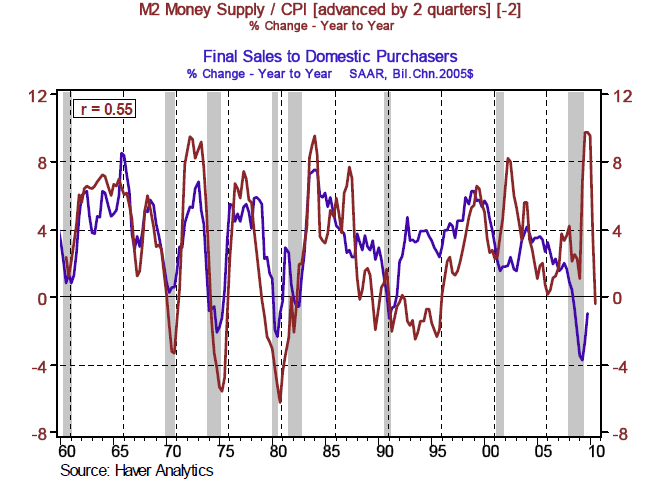
Similarly, it is difficult to feel overly optimistic about future growth in aggregate demand with a contracting price-adjusted M2 money supply. As Chart 4 suggests, growth in price-adjusted M2 is not nearly as good a leading indicator of real aggregate demand growth as it was from 1960 through the early 1980s. But, if real M2 has any remaining predictive power, then the collapse in its growth in the past year is cause for some caution in getting overly optimistic about growth in aggregate demand later in 2010.
Chart 4
In sum, we are in agreement with the Federal Open Market Committee that "economic conditions, including low rates of resource utilization, subdued inflation trends, and stable inflation expectations, are likely to warrant exceptionally low levels of the federal funds rate for an extended period."
Paul Kasriel is the recipient of the 2006 Lawrence R. Klein Award for Blue Chip Forecasting Accuracy
by Paul Kasriel and Asha Bangalore
The Northern Trust Company
Economic Research Department - Daily Global Commentary
Copyright © 2010 Paul Kasriel
Paul joined the economic research unit of The Northern Trust Company in 1986 as Vice President and Economist, being named Senior Vice President and Director of Economic Research in 2000. His economic and interest rate forecasts are used both internally and by clients. The accuracy of the Economic Research Department's forecasts has consistently been highly-ranked in the Blue Chip survey of about 50 forecasters over the years. To that point, Paul received the prestigious 2006 Lawrence R. Klein Award for having the most accurate economic forecast among the Blue Chip survey participants for the years 2002 through 2005.
The opinions expressed herein are those of the author and do not necessarily represent the views of The Northern Trust Company. The Northern Trust Company does not warrant the accuracy or completeness of information contained herein, such information is subject to change and is not intended to influence your investment decisions.
Paul L. Kasriel Archive |
© 2005-2022 http://www.MarketOracle.co.uk - The Market Oracle is a FREE Daily Financial Markets Analysis & Forecasting online publication.


