


Silver The Most Bullish Currency
Commodities / Gold and Silver 2010 Apr 20, 2010 - 06:17 PM GMTBy: Hubert_Moolman

 Gold appears extremely bullish in most of the world’s currency. Probably more than it has ever been in the last 30 years. However, there is one currency in which gold is looking really bearish.
That currency is none other than the world’s other true currency called silver. The outlook for silver as a currency is as bright as it has ever been; in fact, in my opinion, there is no currency that will match silver over the next couple of years
Below is a long term chart of the gold/silver ratio, which translates to the silver price of gold.
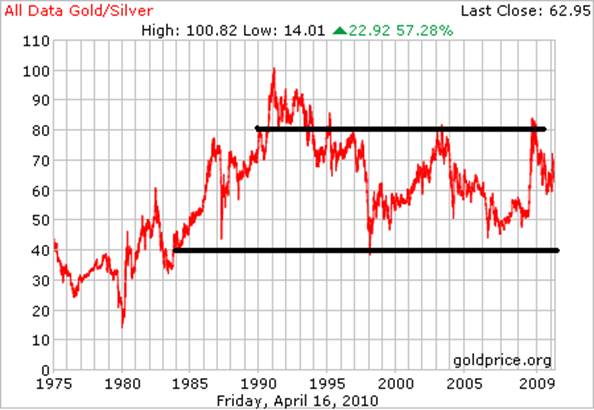
chart generated on goldprice.org
The current price of ounce of gold in real money is about 62.95 ounces of silver. If you look at the long term chart you will see that the highest price was about 100 ounces of silver and the lowest about 14; this is quite a ridicules fluctuation in the ratio between two of the most stable metals and forms of money on this planet. This big fluctuation is not a reflection on gold or silver’s instability, but it is indicative of the flawed monetary system we have today .
What one can also see on the chart is that the ratio has strong resistance around the 80 level and there is good support at the 45 – 50 level. The ratio has been range bound for almost 2 decades between the above mentioned support and resistance.
Notice that even during the market crash of end 2008; the ratio did not successfully breach the 80 level, despite silver being really weak. After falling back to 60-61 since the crash of 2008, the ratio has tried to challenge the 80 level again but has failed twice (can be seen on a short term chart) at the 70 level. This is a bad sign for gold’s price in silver and it is an indication that the momentum is on the side of this ratio going back to the 40-45 level (relatively fairly soon in my opinion).
On the chart of this ratio, a head and shoulder pattern has developed. Below I have illustrated this on the silver/gold ratio instead.
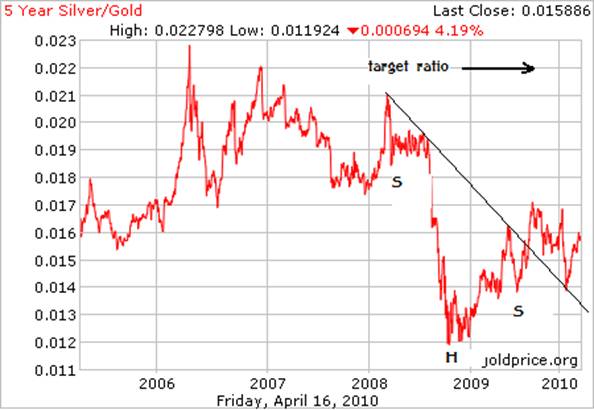
chart generated on goldprice.org
As you can see there is a reverse head and shoulder pattern developing. The price has broken through the neckline, has come back to test the support of that neckline, and is ready to take off to the target of 0.022 or alternatively stated as 45.45 in terms of the gold/silver ratio. What is also interesting is that this pattern is almost a replica of the extremely bullish pattern on the silver chart.
These are all good signs for silver as well as for gold going forward, since gold’s nominal (fiat) price normally rallies when silver’s gold price rallies.
Why is the case for silver so extremely bullish today?
To get to this reason, one has to know what silver is. If one does not know what silver is then one will not understand what will drive the world’s great silver rush.
Silver has many uses, possibly superior to any metal or at least the equal of any. However, there is one use that makes the other uses virtually immaterial. That use is silvers’ use as money. Here we specifically refer to money’s feature called: store of value.
Now however, silver’s use as money is not quite as active as it used to be. Silver was demonitized many many years ago. Therefore the paragraph above, though true, is not quite an “active truth”. Silver’s investment demand, which is a measure of its demand as a store of value, is significantly smaller than demand for industrial and other application. If silver has realised its true destiny as money, it should be the other way around; investment demand should be relatively much bigger than demand for industrial and other application.
What is the event or circumstance that will activate silver’s use as money, especially its use as a store of value?
That event or series of events (building up possibly to a main event) is the collapse of the current monetary system. As I have written before, the monetary system is extremely fragile and there have been clear signals that it should likely collapse under the weight of the high debt levels today, as it has in the past.
Over the next couple of years, as these events are unfolding and causing people to search for an alternative to fiat currencies, the time will come, and now is, that silver’s investment demand will explode and will eventually take the price of silver to $ 100 and beyond, and hopefully to where no fiat price exist.
Below is a chart of silver:
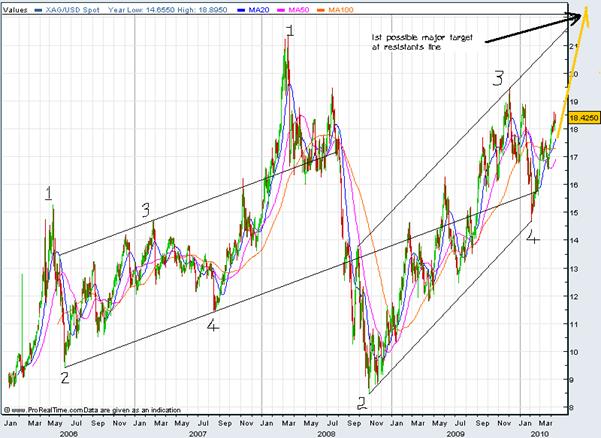
chart generated on fxstreet.com
I have highlighted two patterns on the chart, to illustrate my fractal analysis. Both are marked by 4 points to illustrate how they are similar. The scale of the second pattern is bigger than that of the first, so if the rest of the pattern plays out the same as the first, then we should have a big rally that has started already at point 4 (the one on the right side). The first target is the resistance line as indicated on the chart.
If you would like to know more about my fractal analysis you can purchase my Gold or Silver Fractal Report at $ 50 (R 350) each. For more details contact me via email (below).
I am so confident of my gold and silver analysis that I offer to refund your money should gold not hit $ 1300 dollars by 31 July 2010 or Silver $21.50 also by 31 July 2010.
***
If you find this information useful, please forward it to friends or family so that I can continue to reach people that would not normally read such informative sites as this one. If you would like to subscribe to my newsletter please send me an email. My newsletter is free and I send it out whenever I have something to “say”. I do accept donations though, so that I can continue to research and write; email me for how.
Do not forget to visit my blog, since I publish additional articles there, on a regular basis: http://blogs.24.com/hubertmooolman
May God bless you.
Hubert Moolman
You can email any comments to hubert@hgmandassociates.co.za
© 2010 Copyright Hubert Moolman - All Rights Reserved
Disclaimer: The above is a matter of opinion provided for general information purposes only and is not intended as investment advice. Information and analysis above are derived from sources and utilising methods believed to be reliable, but we cannot accept responsibility for any losses you may incur as a result of this analysis. Individuals should consult with their personal financial advisors.
© 2005-2022 http://www.MarketOracle.co.uk - The Market Oracle is a FREE Daily Financial Markets Analysis & Forecasting online publication.