


Nasdaq Tek Stock NDX at 2050!
Stock-Markets / Stock Markets 2010 Apr 26, 2010 - 01:24 AM GMTBy: Piazzi

 I have to go many posts back to find the first time I mentioned 2050 area as a resistance, and the 1970-2050 range as an active range.
And it seems like just yesterday when I said that the move out of Feb low looked more and more like the move out of July low and might destroy the bears and leave many bulls behind waiting for a pullback.
Well, as a well respected Canadian technician, Bill Carrigan, once said, investing is not a spectator sport :-)
We had quite a week, with two very rough days that coupled with constant noise of financial media about Goldman-SEC and Greece this and PIIGS that felt like the world was coming to an end and stock certificates would lose their value faster than the paper bankers print. Well, as it turned out both days of sharp selling were long opportunities for traders. That’s the thing with a well established trend, it persists.
It, of course is a matter of, first, deciding on the trend, second, having the aptitude to play the trend, third, having the discipline to maintain a holding with the trend.
As for aptitude and discipline, one cannot help others that much. As for identifying a trend, there are many different ways, one can present and discuss one’s methods. It is then up to the audience to pick and choose parts that suits them and their personality.
Speaking of tends, it is, of course, a matter of time frame.
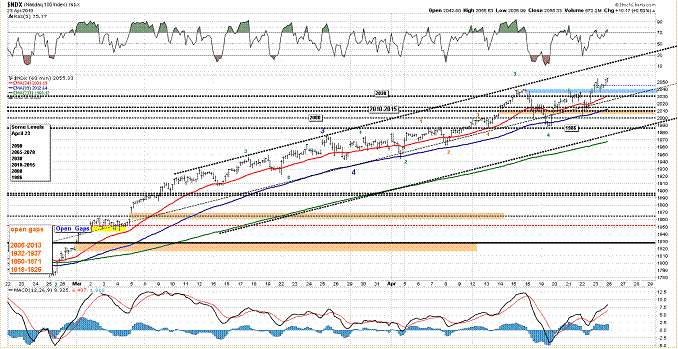
This is weekly chart of NDX that we have seen many times.
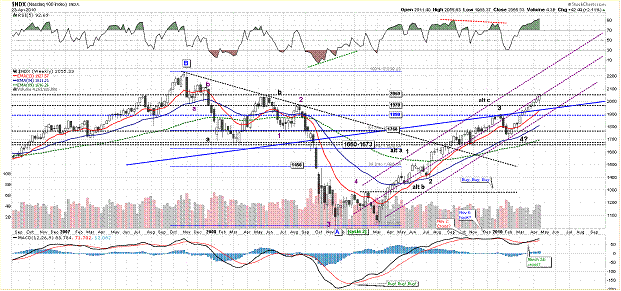
You can go back many posts, and see for yourself that the annotations on the chart have hardly changed. Most of the levels are still the same (I made a change from 1973 to 1970). All of the actionary lines are still the same. It does not take a PhD in astro-physics to see the trend. All my moving averages have been in positive alignments since August 2009.
There, of course, is always the possibility of an uptrend being a counter trend rally. Bears had an excellent opportunity to take control of the market in June-July 2009. They were defeated. They again had a chance in Nov 2009, and could not capitalize. Then came the Jan-Feb 2010.
On February 7, right after what we now was the low, I said
“I think market went into weekend with a state of technical equilibrium, both bulls and bears have to prove themselves in coming days”
That’s exactly what both parties did – proving themselves. Bulls proved that they meant business. Bears proved that they were defeated. What the uptrend that followed the Feb low shows us was that the move from March Low was a 5-wave affair, and as such, and as per tenets of EW, it had a very low probability of being terminated abruptly (I never say never, and do not give a damn what EW or any other methodology says, there is no absolute certainty about the future, ever!).
Now, the weekly is overbought and at resistance.
It was during the first month (or so) of this blog that I wrote a few words about how in uptrends, overboughts are best ignored and oversolds are best accumulated (the reverse goes for downtrends). In range-bound markets, one may be better off selling overbought and buying oversold. One reason is that it makes for good trading. Another reason, which I deem more important, is that one never knows with certainty which way the range resolves.
In an uptrend, overbought readings can become useless as means of trading. In a relentless uptrend, time analysis and cycle analysis may become somewhat erratic, or ineffective as time series and shorter cycles may become stretched (or squeezed depending on whether they are predicting a high or a low). Even with cycles that hit the turns in their window, the low of a strong uptrend may not correct that much.
Price is the most important indicator of all. Everything else – absolutely everything else is what we (and others) do based on some statistical past to build a probabilistic model to predict the future.
"Essentially, all models are wrong, but some are useful".
– George Edward Pelham Box
With that cheery quote, let’s get on with our charts
On the weekly chart above, a move higher than 2050 may put a lot of pressure on whoever has been awaiting a pullback to join the party lest it goes out of style. I hope it does not happen. I hope market corrects or consolidates and relieves some overbought conditions. That’s not because I am benevolent and want others to have a piece of action but because I don’t like fast and furious melt ups. They are hard to gauge and analyze – not much use analyzing a parabolic move, it goes till it runs out of fools and then hangover settles. I hope it does not happen like that, but it is very possible here, depending on whether fat cats finally sell for profit or not.
One thing to keep in mind is that, when price makes new highs, there are mainly two groups of speculators, the shorts who are badly burnt and of little significance, and the happy longs who may have no reason to sell. There no more remain disgruntled longs from earlier peaks to and get out even. So, we need to watch for signs of selling and distribution.
In the weekly frame above, it’s hard to find technical support that would not involve a serious point drop. We have 1970 (80 points lower). We have the blue actionary line and the 13 EMA around 1930 (120 points lower) and those are the closest I can pin point on the chart. If NDX busts above 2050, it can then finds a close support but being overbought may make it hard to psychologically commit a big chunk to a new position. It will be more like the realm of traders and momentum player.
Other than what is apparent from the weekly chart, I ran some price range and volatility-based algorithms that I have developed and also did a standard calculation of floor pivots. I then selected some area of commonality from the two sets and came up with these levels
2090
2065-2070
2030
2010-2015
2000
1986
This is all theoretical, of course, and I treat them as some signposts of probable support and resistance
This is a daily chart
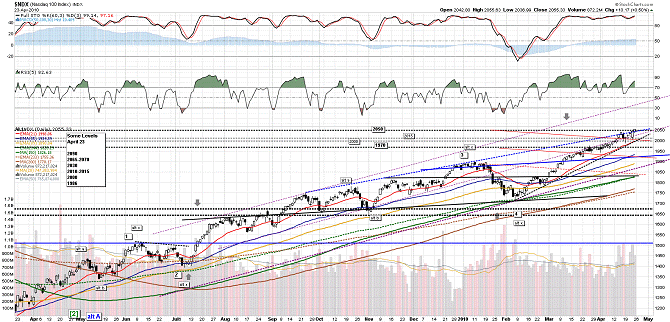
Other than overbought (which may not mean much in an uptrend) and being at resistance, I can’t find much else negative to say about the recent price action. It’s been murderously cruel to bears and very unkind to out-of-position bulls.
There is a lot of support from a lot of levels and all the MAs.
Breadth, however, has been mixed.
Advancers have outpaced decliners every day, and the A/D line has been making new highs. Daily Up volume has been nice and green
Overall the breadth has been good on a day-to-day basis, but the McClellan group of oscillators and the Bullish Percent Index, have gone soft
This is a chart with McClellan group of oscillators
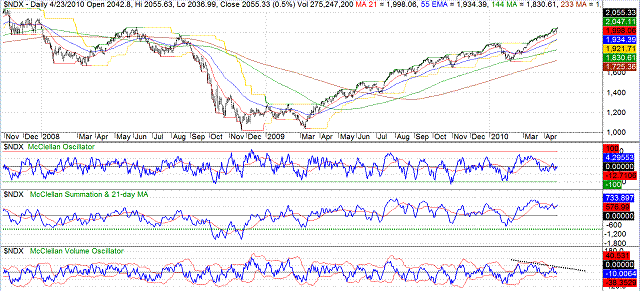
Since March 2009, every time Bullish Percent Index crossed below it MA 10, NDX had some sort of correction
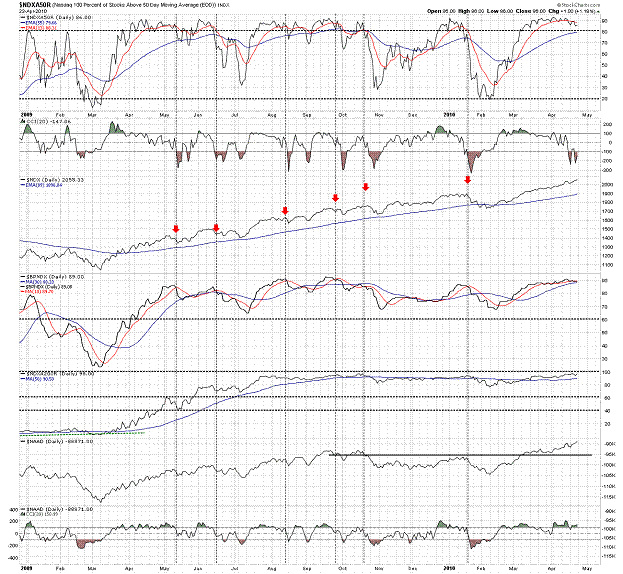
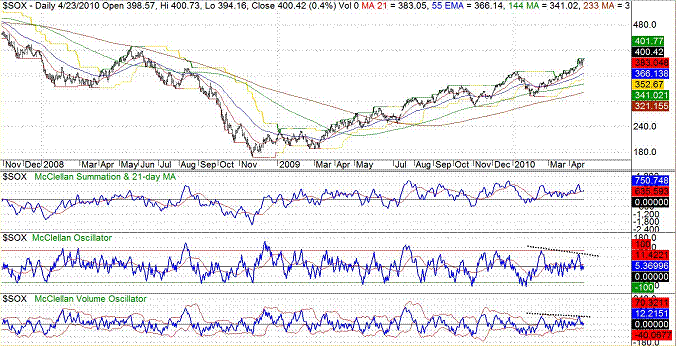
We have the same type of McClellan breadth divergence in the semiconductor group as well
These are just warning signs that may later prove to be early signs of a correction. They do not necessarily mean a top, just part of the whole picture that is not functioning well at this moment. Remember, Price is the final judge of the whole thing, and with a strong trend, other measures, like breadth, can correct and recover while price goes sideway or slightly down.
This is a 60-min chart
There seems to be 3 clear technical levels of importance at this time. The 1990 area was tested twice and played as a springboard for a good run.
The 2010-1015 area was also retested and led the reversal on Thursday.
The 2035-2040 resistance was taken on Friday and looks like a first level of short term support. I’d say that the area between the 2035-2040 and the blue zone and the mid-line of the channel looks like a possible technical buffer zone right now.
Since March this year, the duo-team of 34 and 89 EMA have stopped every short term pullback.
The current count seems to have worked well so far. If correct, we are in a 3rd wave, and may expect a 4th and a 5th to follow. If correct, the 2035-2040-mid-line buffer zone I mentioned above should hold. A failure of that zone early next week may put the current short term move in jeopardy.
So,
Market has been brushing off anything bad that media has thrown at it: Greece, PIIGS, Goldman-SEC, Financial Reform, FED’s end of QE, The Chinese and what they say about mortgages in China, whatever. Does that mean we are in a true bull that will run forever, and ever? Does it mean that the sugar high from government borrowing and FED liquidity has got the better of all participants? I don’t know, but why not let the market decide when it is that I should fold? The game is still the same as far as I am concerned, ignore the noise, follow the technicals, be flexible, methodical and disciplined, and do not try to tell the market what it should do.
And keep an eye on these levels
Once more, levels I will be watching are
2090
2065-2070
2030
2010-2015
2000
1986
From a broader point of view, for now, as long as NDX is above 1970, it's either rallying or consolidating.
Have a Nice Week!
By Piazzi
http://markettime.blogspot.com/
I am a self taught market participant with more than 12 years of managing my own money. My main approach is to study macro level conditions affecting the markets, and then use technical analysis to either find opportunities or stay out of trouble. Staying out of trouble (a.k.a Loss) is more important to me than making profits. In addition to my self studies of the markets, I have studied Objective Elliott Wave (OEW) under tutorship of Tony Caldaro.
© 2010 Copyright Piazzi - All Rights Reserved Disclaimer: The above is a matter of opinion provided for general information purposes only and is not intended as investment advice. Information and analysis above are derived from sources and utilising methods believed to be reliable, but we cannot accept responsibility for any losses you may incur as a result of this analysis. Individuals should consult with their personal financial advisors.
© 2005-2022 http://www.MarketOracle.co.uk - The Market Oracle is a FREE Daily Financial Markets Analysis & Forecasting online publication.