


SPX Stock Market Index Targets 1230 Trend Reversal Level
Stock-Markets / Stock Markets 2010 Apr 26, 2010 - 02:58 AM GMTBy: Andre_Gratian

 Current Position of the Market
Very Long-term trend - Down! The very-long-term cycles are down and if they make their lows when
expected, the bear market which started in October 2007 should continue until 2014.
SPX: Long-term trend - Up! We are in a medium-term bull market, which is a corrective move within a long term bear
market. This bull market should last until 2011
SPX: Intermediate trend - Having gone past the conservative 1200 projection, a liberal count to about 1230 appears to be the aim of the SPX
Analysis of the short-term trend is done on a daily basis with the help of hourly charts. It is an important adjunct to the analysis of daily and weekly charts which determines the course of longer market trends.
Daily market analysis of the short term trend is reserved for subscribers. If you would like to sign up for a FREE 4-week trial period of daily comments, please let me know at ajg@cybertrails.com .
Overview:
Having sailed past the conservative target of 1200 with little hesitation, the SPX appears to be heading for the more liberal count of 1229-30.
Low volume and less than stellar breadth has plagued the last phase of the advance since 1044.50. But only now is the price pattern beginning to suggest the kind of activity which is typical of a top formation. The analyst has to be patient and wait until the market reveals its intentions. This advance has strained the patience of the very best. It’s as if it had a goal in mind and was not going to be deterred from reaching it. And, of course, it does! The re-accumulation phase between 1060 and 1080 in early February created a Point & Figure pattern that could be measured conservatively to 1192 and liberally to 1236. In-between was a Fibonacci projection to 1200. I chose to play it safe and forecast a move to 1200. But after a brief set-back at 1192, the SPX decided to go for the more rarefied atmosphere, and it looks as if it is ready to take the full count, or nearly so. A small reaccumulation phase around 1190 is projecting 1229, and this is matched by a Fibonacci target as well. It looks relatively safe to estimate that this is where the final tick of the move from the March 2009 low will take place.
The price formation is also beginning to display what may be an ending diagonal pattern. If so, the SPX should end the current move around 1220 and after another pull-back, rise to the target area.
As you will see, the breadth indicators are giving credibility to this scenario, and the negative divergence which was lacking in the momentum indicators is now clearly evident.
The sentiment indicators reached a confirming extreme a little early, but I believe they will turn out to be the correct forecast.
Analysis
Chart Pattern and Momentum
We’ll start with the Weekly Chart and go directly to the breadth indicator at the bottom. I mentioned earlier that it had been less than stellar since the beginning of the last phase from 1044.50. Pathetic might be a better choice of words. However, you have to know that this indicator gives ample advance warning and one must look to the daily and hourly charts in order to realize more refined timing. Look at how much warning there was that we were coming to the end of the decline in March 2009. It broke out of its downtrend channel and first gave signs of positive divergence in the Fall of 2008. But that’s because we were in a straight down period of high volatility. The top was very different and the lag much shorter.
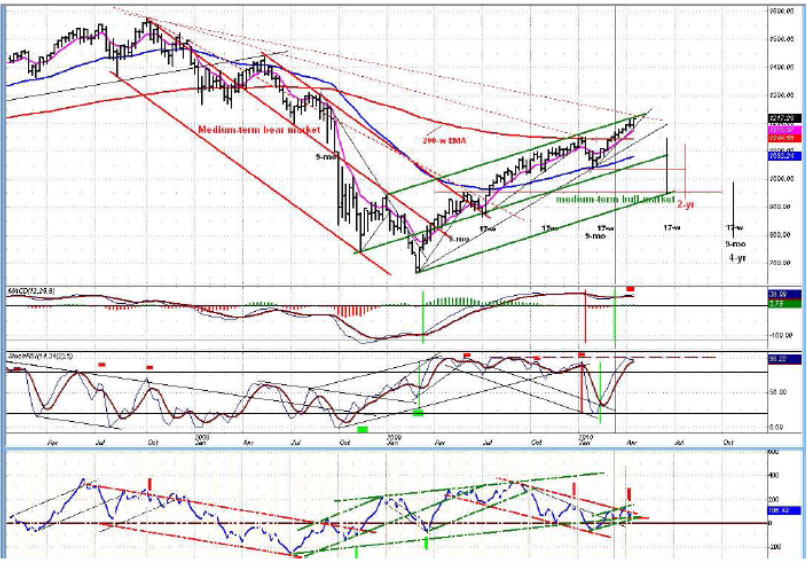
Next, we’ll want to look at where the next dominant cycles are scheduled to bottom. As you can see, the first ones are not that far away and this is another reason why we should begin to look for a top. Finally, the MACD is showing negative divergence and the lower indicator is close to crossing over.
Next, the Daily Chart. Before giving a sell signal, the price chart shows that it has a little more work to do.
After completing the suggested pattern at the proposed target, it will have to break a trend line and will probably find some support in the area of the moving averages; especially the 50-dma (blue) which corresponds with the bottom trend line of the small brown channel. That could give rise to at least a bounce.
Then, upon falling further, it should find even better support on the blue trend line of the intermediate channel. Only after it has broken below that line decisively can we say that the trend from March 2009 has been reversed.
The lower indicator, which is a breadth oscillator created in the same manner as the weekly version above, agrees. It has found support on the lower trend line of a green channel which replicates the index phase from 1044.50, and although it shows plenty of deceleration and divergence, it will not give a sell signal until it breaks the green trend line and moves completely out of its channel.
The momentum indicator above it also shows serious negative divergence, but it is now back in an uptrend and will have to turn down before a signal is given.
The price and indicator analysis confirm that although we may get a reversal in the next week or ten days, we may not begin an important decline until after late May -- the time frame that has been discussed before.
Now, as we usually do, we’ll finish our analysis with the Hourly Chart. This is a close up, so that we can look at the terminal stage of the move, with the blue channel representing deceleration of the trend which has been taking place since 3/22. It appears that this weak uptrend is now culminating with the formation of a terminal pattern, referred to as an ending diagonal. Since this formation is made up of 5 waves and we are only in the third wave, we should have a wave 4 pull-back followed by a 5th and final wave. Only after this formation is complete will the SPX be in a position to move out of the blue channel on the downside.
This is also what the indicators are suggesting: although the bottom (breadth) oscillator is exhibiting severe negative divergence, the momentum indicators probably will not until the final wave occurs.
I have already given targets for the move and will repeat them in the “projections” section.
Cycles
Since little has changed, it seems appropriate to repeat what was said in the last newsletter, with one small modification:
The important cycles, going forward, are best seen on the weekly chart. The first to make its low toward the end of June will be the 17-wk cycle, and it will do so just ahead of the 2-yr cycle. From this, we can probably assume that June and early July will be in a downtrend.
Before that, we have two small cycles bottoming in early May, and the 20-wk cycle about the middle of the month. If the expected ending diagonal takes place, these cycles should pull the index into an initial down phase.
The lowest point of the correction should come in October with the 4-yr, 9-mo and 17-week cluster.
Projections:
As the SPX progressed upward, it made a re-accumulation pattern around the 1190 level from which can be derived a Point & Figure count to about 1230, which confirms the liberal count of the base formation made in early February.
Wave 5 of the assumed ending diagonal is therefore expected to reach about 1230, and this is born out by a short-term Fibonacci projection to the same level. Wave 3, the current phase, should end up near 1220 before the start of wave 4.
It is too early to make a solid projection for the retracement into the 4-year low in October, but we can make an educated guess of at least 950.
The QQQQ is also in a solid uptrend from its March ‘09 low. But it is quickly approaching the zenith of its move. On the Point & Figure chart, it had a conservative target of 46.50 which caused temporary profittaking when it was reached. The more liberal target is 51.50 -- about a point higher than where it closed last Friday (50.52)
Breadth
With the creation of a weekly breadth oscillator, the Summation Index (courtesy of StockCharts.com) has become less useful than it was as a representation of the intermediate condition of the NYSE breadth. But it still deserves to be analyzed because it gives us another vantage point.
The index has gone sideways for the past two weeks, which has resulted in a correction of the RSI. This gives some room for a little more of an advance in the SPX, which is what the other indicators also suggest, and what is expected.
Market Leaders and Sentiment
One important gauge of sentiment, is whether the NDX is outperforming the SPX or not. If we look at the relative strength chart which is provided courtesy of StocksCharts.com, it is clear that the NDX is still the stronger of the two.
For an intermediate top to be made, it will have to reflect the fact that the NDX has become noticeably weaker than its counterpart. Whether or not this can take place in the next ten days or so, is questionable and is another reason not to expect the beginning of a significant decline until after the end of May.
It would be normal for the NDX to achieve its projected high and begin to show some weakness before the SPX does.
I have kept in place the Sentiment Reader (courtesy of same) which was posted in the last newsletter so that it can be compared with the more recent reading.
As you can see, there has been some improvement. Although the long-term reading remains predominantly bearish, it does not have the same urgent connotation that the previous one did. I would expect that it will probably become more negative as the market makes its final high.
There is good evidence that the final high of the move from 667 on March 2009 is fast approaching. If the assumption that the SPX is making a terminal pattern in the form of an ending diagonal is correct, we could see the top projection of about 1230 being met in the next 10 days.
However, the evidence also tells us that the beginning of a substantial decline will not start until the end of
May, thereby suggesting that the index could build a distribution phase in the form of a sideways move before rolling over.
Andre
If precision in market timing is something which is important to you, you should consider a trial subscription to my service. It is free, and you will have four weeks to evaluate the claims made by the following subscribers:
Awesome calls on the market lately. Thank you. D M
Your daily updates have taken my trading to the next level. D
… your service has been invaluable! It's like having a good technical analyst helping me in my trading. SH
I appreciate your spot on work more than you know! M
But don't take their word for it! Find out for yourself with a FREE 4-week trial. Send an email to ajg@cybertrails.com .
By Andre Gratian
MarketTurningPoints.com
A market advisory service should be evaluated on the basis of its forecasting accuracy and cost. At $25.00 per month, this service is probably the best all-around value. Two areas of analysis that are unmatched anywhere else -- cycles (from 2.5-wk to 18-years and longer) and accurate, coordinated Point & Figure and Fibonacci projections -- are combined with other methodologies to bring you weekly reports and frequent daily updates.
“By the Law of Periodical Repetition, everything which has happened once must happen again, and again, and again -- and not capriciously, but at regular periods, and each thing in its own period, not another’s, and each obeying its own law … The same Nature which delights in periodical repetition in the sky is the Nature which orders the affairs of the earth. Let us not underrate the value of that hint.” -- Mark Twain
You may also want to visit the Market Turning Points website to familiarize yourself with my philosophy and strategy.www.marketurningpoints.com
Disclaimer - The above comments about the financial markets are based purely on what I consider to be sound technical analysis principles uncompromised by fundamental considerations. They represent my own opinion and are not meant to be construed as trading or investment advice, but are offered as an analytical point of view which might be of interest to those who follow stock market cycles and technical analysis.
Andre Gratian Archive |
© 2005-2022 http://www.MarketOracle.co.uk - The Market Oracle is a FREE Daily Financial Markets Analysis & Forecasting online publication.