


How to Channel an Impulse Wave on a Price Chart
InvestorEducation / Elliott Wave Theory Apr 26, 2010 - 09:43 AM GMTBy: EWI

 Susan Walker writes: How do you choose one lesson from a basic tutorial that is chock-full of excellent information about Elliott wave analysis? You could browse through all 50 sections distributed over 10 lessons. Or you could do what some people do when they open a dictionary: let the book fall open and point your finger at a word. Sometimes you learn more from a random search than a deliberate one.
That's exactly how I chose this excerpt from EWI's Basic Tutorial to show how clear the writing and illustrations are. The one best place to start learning about wave analysis is this online tutorial, which is available to all Club EWI members -- a membership that is free and that brings you many resources about the kind of technical analysis and forecasting that we do here at Elliott Wave International.
The topic that my electronic finger pointed to online when I opened the online Basic Tutorial was Lesson 6.2: Channeling Technique. These four graphs and the accompanying explanation give a tantalizing taste of what you can learn when you take The EWI Basic Tutorial.
* * * * *
Excerpted from The EWI Basic Tutorial
Chapter 6.2: Channeling Technique
R.N. Elliott noted that parallel trend channels typically mark the upper and lower boundaries of impulse waves, often with dramatic precision. The analyst should draw them in advance to assist in determining wave targets and provide clues to the future development of trends.
The initial channeling technique for an impulse requires at least three reference points. When wave three ends, connect the points labeled "1" and "3," then draw a parallel line touching the point labeled "2," as shown in Figure 2-8. This construction provides an estimated boundary for wave four. (In most cases, third waves travel far enough that the starting point is excluded from the final channel's touch points.)
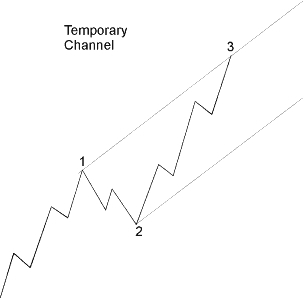
Figure 2-8
If the fourth wave ends at a point not touching the parallel, you must reconstruct the channel in order to estimate the boundary for wave five. First connect the ends of waves two and four. If waves one and three are normal, the upper parallel most accurately forecasts the end of wave five when drawn touching the peak of wave three, as in Figure 2-9. If wave three is abnormally strong, almost vertical, then a parallel drawn from its top may be too high. Experience has shown that a parallel to the baseline that touches the top of wave one is then more useful, as in the illustration of the rise in the price of gold bullion from August 1976 to March 1977 (see Figure 6-12). In some cases, it may be useful to draw both potential upper boundary lines to alert you to be especially attentive to the wave count and volume characteristics at those levels and then take appropriate action as the wave count warrants.
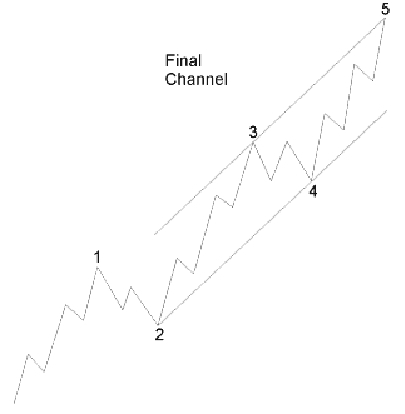
Figure 2-9
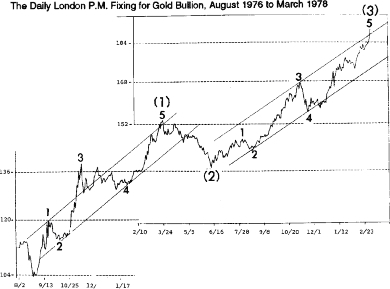
Figure 6-12
Throw-over
Within parallel channels and the converging lines of diagonal triangles, if a fifth wave approaches its upper trendline on declining volume, it is an indication that the end of the wave will meet or fall short of it. If volume is heavy as the fifth wave approaches its upper trendline, it indicates a possible penetration of the upper line, which Elliott called "throw-over." Near the point of throw-over, a fourth wave of small degree may trend sideways immediately below the parallel, allowing the fifth then to break it in a final gust of volume.
Throw-overs are occasionally telegraphed by a preceding "throw-under," either by wave 4 or by wave two of 5, as suggested by the drawing shown as Figure 2-10, from Elliott's book, The Wave Principle. They are confirmed by an immediate reversal back below the line. Throw-overs also occur, with the same characteristics, in declining markets. Elliott correctly warned that throw-overs at large degrees cause difficulty in identifying the waves of smaller degree during the throw-over, as smaller degree channels are sometimes penetrated on the upside by the final fifth wave. Examples of throw-overs shown earlier in this course can be found in Figures 1-17 and 1-19.
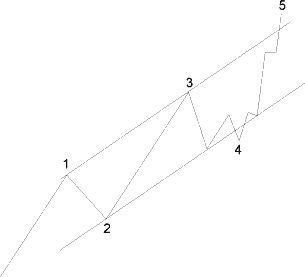
Figure 2-10
- What the basic Elliott wave progression looks like
- Difference between impulsive and corrective waves
- How to estimate the length of waves
- How Fibonacci numbers fit into wave analysis
- Practical application tips for the method
- More
Keep reading this free tutorial today.
Susan C. Walker writes for Elliott Wave International, a market forecasting and technical analysis company.
© 2005-2022 http://www.MarketOracle.co.uk - The Market Oracle is a FREE Daily Financial Markets Analysis & Forecasting online publication.