


Gold and Dow Jones Analysis - Worrying Times
Stock-Markets / Financial Markets Aug 29, 2007 - 12:29 AM GMTBy: Brian_Bloom
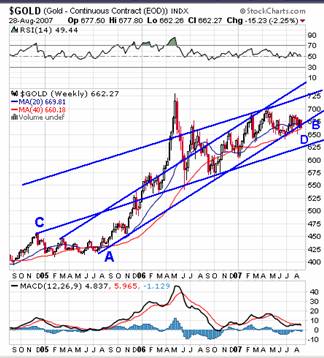
 That the direction of the gold price has been in a state of indecision can be seen from the following chart. Since the gold price peaked in May 2006, it has been trending sideways, tracing out what appeared to be a Triangle formation. Some weeks ago this analyst thought he saw evidence that the gold price was about to break up out of the triangle. In fact, it did break up briefly – only to pull back again. Intriguingly, the RSI oscillator has been crawling along the 50% level – clearly incapable of pointing a firm direction.
courtesy stockcharts.com.
In technical analysis, a Triangle is a formation of indecision. As the bulls battle the bears, the rising bottoms are offset against falling tops until eventually, one side wins and a breakout occurs – usually a strong breakout.
There is a third possibility: The bulls and bears call a truce. In this case, the battle which gave rise to the formation ends in a whimper and the price finally drifts sideways in a desultory fashion.
The above chart seems to be giving signals that the “angle of incline” of the gold price rise wants to flatten out. The trendline A-B, which has seven points of contact, seems to be wanting to give way to a sideways tracking price that remains above both its 20 week and 40 week Moving Averages, and where the 20 week MA remains above the 40 week MA. i.e. Technically, there is as yet no sign that the gold price wants to fall. What seems more likely is that it may enter a shallower angle of incline bounded by trendline C-D which has 5 points of contact.
This is a very interesting development, because it negates the possibility that the industrial markets might “collapse” at this point in time.
Yes, there is a potentially bearish “megaphone” formation on the DJIA chart as can be seen below (courtesy stockcharts.com)
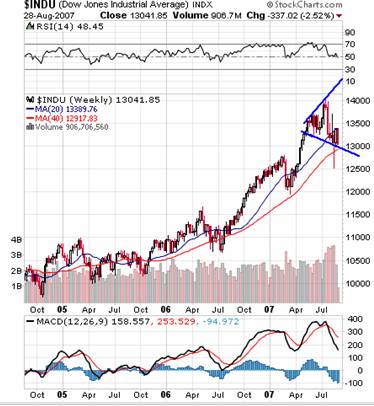
However, the weekly DJIA chart is also tracking above its 20 and 40 week MA, and the 20 week MA is also above the 40 week MA. The megaphone might morph to become a diamond which, in turn, could be bullish or bearish depending on circumstances.
Arguably, the gold price is the ultimate litmus test as to the state of the world economy and, technically, the gold price chart below (courtesy stockcharts.com) is calling for a significantly higher price destination of around $1400 an ounce – but with no reference to time.
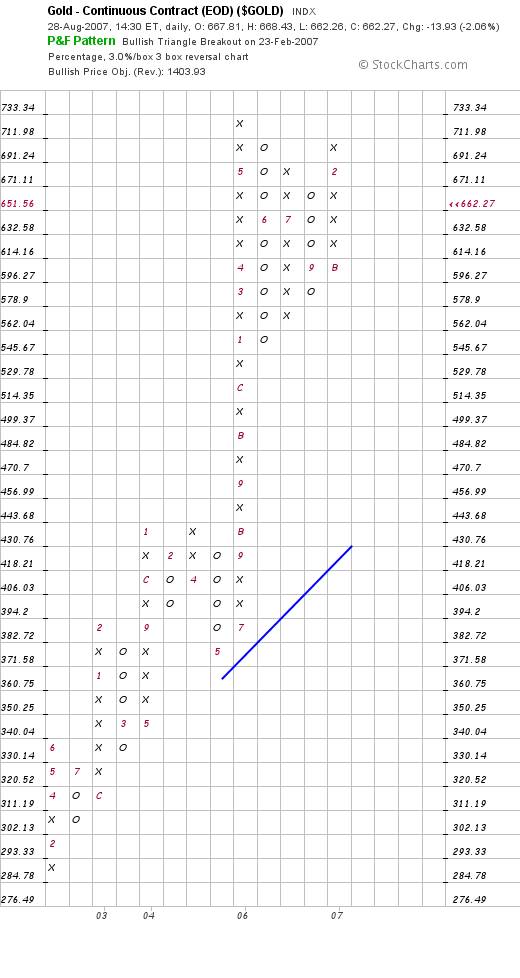
This price destination will be negated (in terms of the above chart) if the gold price falls to $632 an ounce or less. However, in terms of the first chart above, even a level of $632 would not necessarily be bearish. It would merely bring the gold price into a shallower angle of incline .
It is emphasised that until this actually happens, the $1,400 target will remain intact.
So the question arises: Is there any technical evidence that the gold price might fall to $632 or below?
The monthly chart below (courtesy Decisionpoint.com) is showing a “sell” signal on its PMO oscillator.
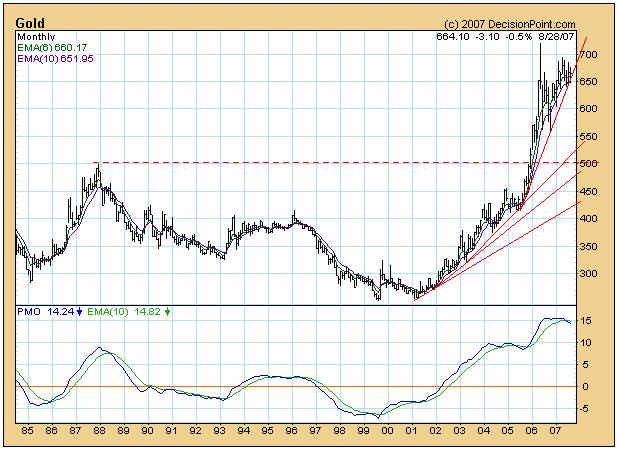
However, there are two factors which mitigate against this being a genuine sell signal:
- An oscillator is intended to be a trading indicator, and is not much use on monthly charts. The most one can conclude from any signal on a monthly chart's oscillator is that the previous trend may be reaching a point of indecision. Arguably, the PMO oscillator could remain in overbought territory for years.
- Unfortunately, if the gold price remains indecisive for more than a month (and does not rise from here), the rising trendline above is likely to be penetrated on the downside. Thereafter the monthly chart seems to offer significant support at $650 an ounce, less support at $640 and, if that level is broken, further significant support at $600 an ounce.
Importantly, if $600 an ounce is reached, this level will be below the support of trendline C-D in the first chart.
Interim Conclusion
For the time being, it looks like gold is likely to track sideways, but stay above $640 an ounce – leaving the $1,400 target intact. i.e. All the Fed and the Central Bankers have achieved is they have managed to buy some time.
But the story does not end there:
One key to the future direction of all markets might lie in the price of money. Which way will Bond Yields break? If they break up – then we might expect inflation to raise its head. If they fall – then we may expect deflation to raise its head.
The two charts below (courtesy Decisionpoint.com) illustrate the indecision in the markets even so far as this question is concerned.
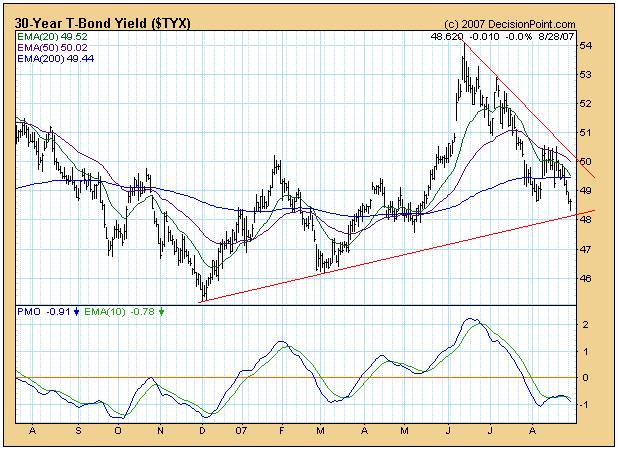
The daily chart shows falling 20 and 50 day MAs and a yield which seems to want to bounce up from the trendline.
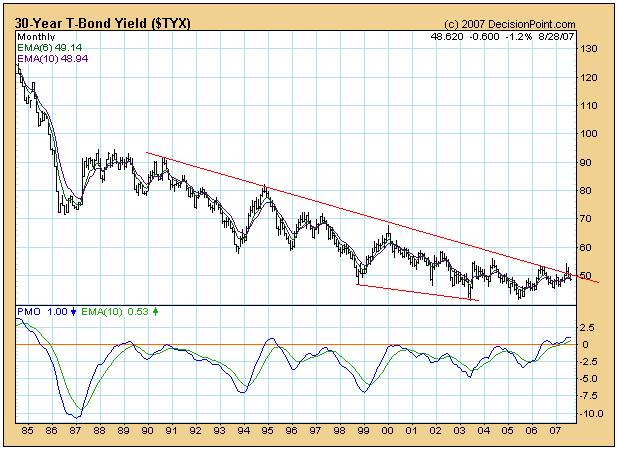
The monthly chart
The monthly chart above is showing a yield that wants to break up though its falling trendline.
On balance, one might conclude that yields could travel sideways from here given the resistance of the falling trendline in the daily chart.
Ultimately, in this analyst's view, the question revolves around what the industrial markets are likely to do.
If one looks at the Wilshire 5000 index below (2.5% X 3 box reversal P&F courtesy stockcharts.com) a very worrying scenario manifests:
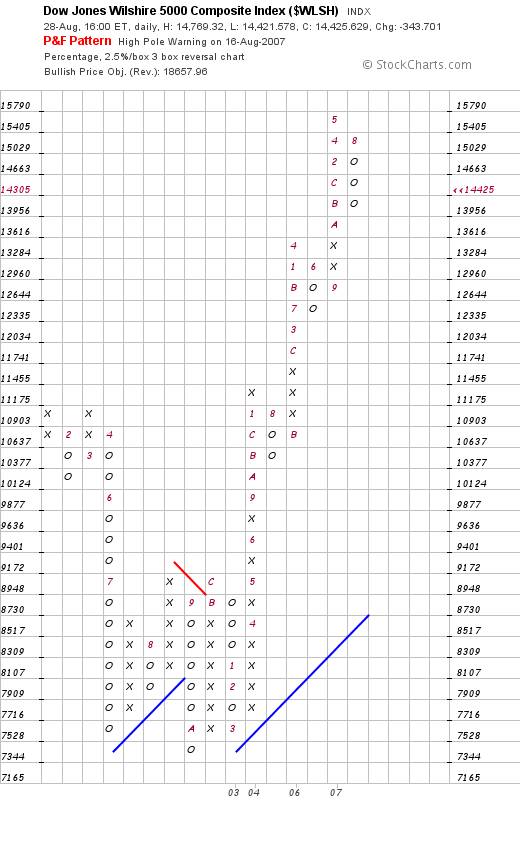
There is “High Pole” warning which could bring the index all the way back to 12644.
However, should this happen, then a high pole warning will manifest on the less sensitive 3% X 3 Box reversal chart below.
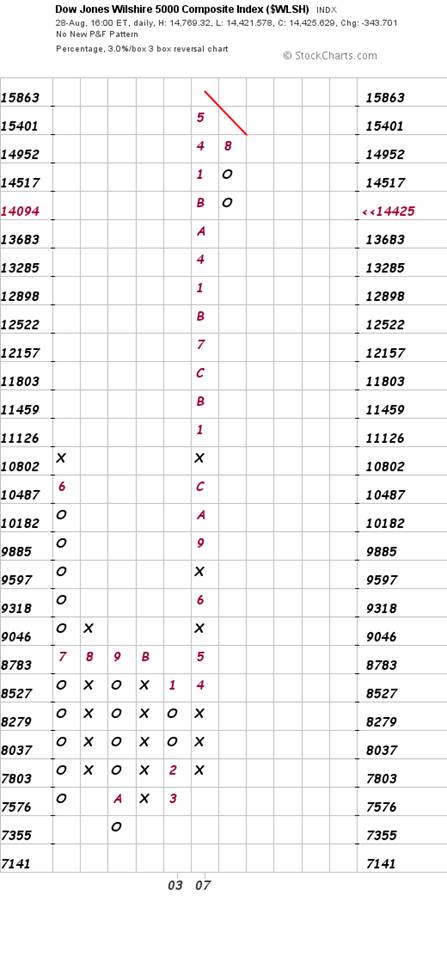
Under such a scenario, the Wilshire Index could pull all the way back to 8,783 – which represents a 38% fall
In turn, such a pullback would confirm that the pattern on the $SPX chart below was indeed a Double Top
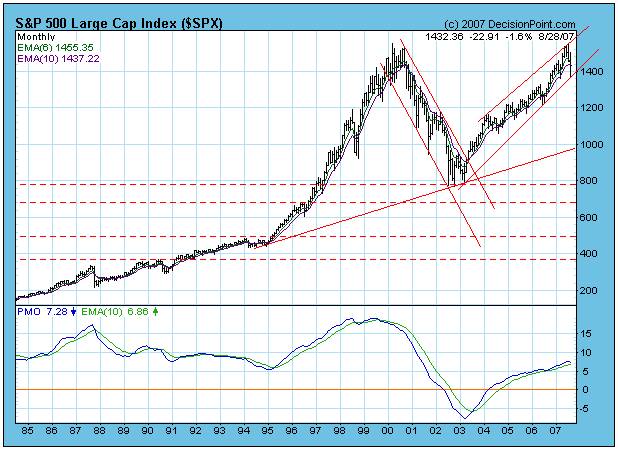
Unfortunately, in this case, a similar 38% fall of the $SPX would bring this index back from 1432 to 888 – a level which is below the support of its 20 year rising trendline.
Conclusion
If the USA is to be regarded as a proxy for world markets, we are facing extraordinarily worrying times. Ultimately, fundamental values are what drive the direction of markets, because fundamental values are what drive demand and supply which finally manifest in price movements.
Fundamentally, because the fossil fuel energy markets no longer have the capacity to drive the world economy, and because there is a lack of obvious successor to fossil fuels, it is of significant concern that the underlying edifice of debt may begin to unravel.
Cracks are already beginning to appear in the sub-prime mortgage markets which are causing an escalation of general uncertainty. In turn, this uncertainty is being reflected in the charts.
In this analyst's view, anyone who is prepared to make a definitive call as to the Primary direction of the markets at this point in time is either delusional or does not fully appreciate the gravity of the underlying issues. No one on the planet can make an informed call at this point in time – either up or down. However, if the US politicians continue to play their disingenuous games, the odds favour some form of catastrophe to manifest within the foreseeable future.
Solutions to our problems do not lie in the money markets. They lie in facilitating buoyant economic activity which, in turn, will be facilitated by a migration to new energy paradigms that are unrelated to either fossil fuels or nuclear fission.
The politicians, bankers and fossil fuel lobbies have finally snookered the world economy. There is no other way. We either embrace new energy paradigms or we face a collapsing world economy. If the bankers try to print their way out of this snooker, the collapse will follow a period of hyperinflation. If they try to tighten money supply collapse will be immediate. The best we can hope for is a sideways movement of markets until the new energy paradigms have been embraced, and their power to drive the world economy begins to manifest.
Sensing opportunity, the nuclear fission lobby appears to be dangling a fat, juicy worm.
This analyst's advice: Be very careful. There is a barbed hook being hidden by the enticingly wriggling worm. Nuclear fission is not the way to go.
By Brian Bloom
www.beyondneanderthal.com
Since 1987, when Brian Bloom became involved in the Venture Capital Industry, he has been constantly on the lookout for alternative energy technologies to replace fossil fuels. He has recently completed the manuscript of a novel entitled Beyond Neanderthal which he is targeting to publish within six to nine months.
The novel has been drafted on three levels: As a vehicle for communication it tells the light hearted, romantic story of four heroes in search of alternative energy technologies which can fully replace Neanderthal Fire. On that level, its storyline and language have been crafted to be understood and enjoyed by everyone with a high school education. The second level of the novel explores the intricacies of the processes involved and stimulates thinking about their development. None of the three new energy technologies which it introduces is yet on commercial radar. Gold, the element , (Au) will power one of them. On the third level, it examines why these technologies have not yet been commercialised. The answer: We've got our priorities wrong.
Beyond Neanderthal also provides a roughly quantified strategic plan to commercialise at least two of these technologies within a decade – across the planet. In context of our incorrect priorities, this cannot be achieved by Private Enterprise. Tragically, Governments will not act unless there is pressure from voters. It is therefore necessary to generate a juggernaut tidal wave of that pressure. The cost will be ‘peppercorn' relative to what is being currently considered by some Governments. Together, these three technologies have the power to lift humanity to a new level of evolution. Within a decade, Carbon emissions will plummet but, as you will discover, they are an irrelevancy. Please register your interest to acquire a copy of this novel at www.beyondneanderthal.com . Please also inform all your friends and associates. The more people who read the novel, the greater will be the pressure for Governments to act.
Brian Bloom Archive |
© 2005-2022 http://www.MarketOracle.co.uk - The Market Oracle is a FREE Daily Financial Markets Analysis & Forecasting online publication.